The data from Australian Bureau of Statistics (ABS) revealed housing prices were up 3.6% annually, with every capital city recording an increase for the first time since December 2014.
All capital cities recorded an increase in property prices in the December quarter, led by Melbourne and Canberra, both up 3.4%, and Sydney, up 3%.
Buying a home or looking to refinance? The table below features home loans with some of the lowest interest rates on the market for owner occupiers.
| Lender | Home Loan | Interest Rate | Comparison Rate* | Monthly Repayment | Repayment type | Rate Type | Offset | Redraw | Ongoing Fees | Upfront Fees | LVR | Lump Sum Repayment | Additional Repayments | Split Loan Option | Tags | Features | Link | Compare |
|---|---|---|---|---|---|---|---|---|---|---|---|---|---|---|---|---|---|---|
6.04% p.a. | 6.06% p.a. | $2,408 | Principal & Interest | Variable | $0 | $530 | 70% | Featured Online ExclusiveUp To $4K Cashback |
| |||||||||
5.99% p.a. | 5.90% p.a. | $2,396 | Principal & Interest | Variable | $0 | $0 | 80% | Featured Apply In Minutes |
| |||||||||
6.14% p.a. | 6.16% p.a. | $2,434 | Principal & Interest | Variable | $0 | $250 | 60% | Featured Unlimited Redraws |
|


Showcasing the divergence between house and unit performance, house prices rose 3.9% in Sydney and 3.7% in Melbourne, while attached dwelling prices rose 1.4% and 2.5% respectively.
ABS Head of Prices Statistics Michelle Marquardt said a number of key measures of the property market saw positive growth over the quarter.
"The rise in property prices is consistent with a range of housing market indicators. New lending commitments to households, auction clearance rates and days on market all improved during the December quarter," Ms Marquardt said.
"Annually, residential property prices rose 3.6%. This is the first time that all capital cities have seen an annual rise since the December quarter 2014.
"The largest rise in property prices was in Hobart (6.4%), followed by Canberra (5.2% and Perth (4.2%)."
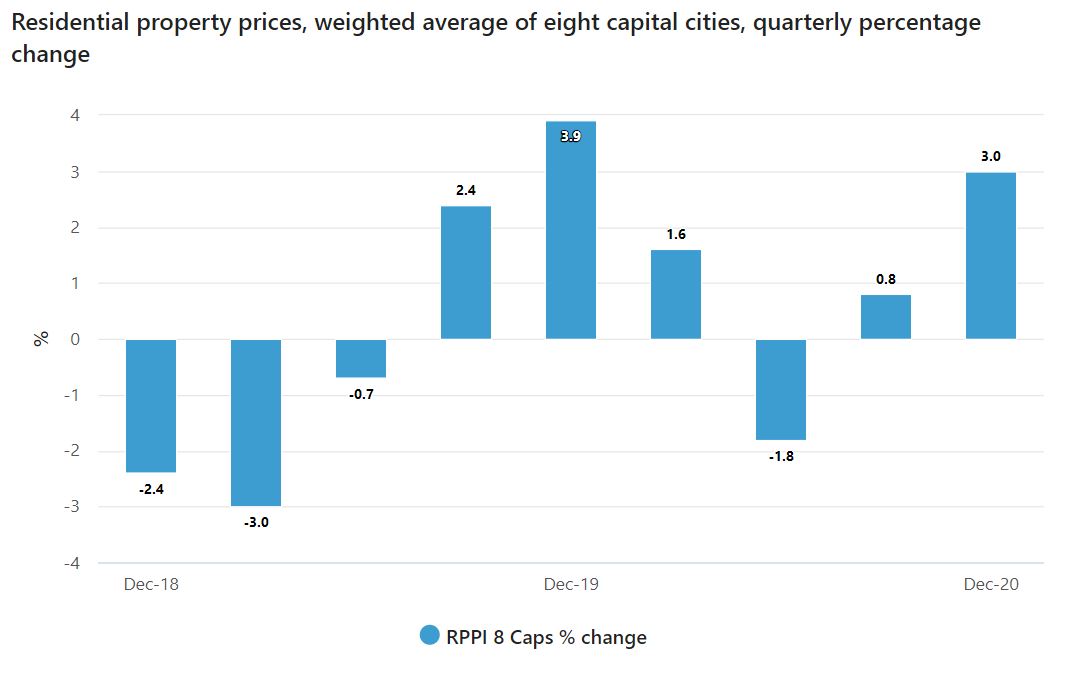
Source: ABS
The ABS found the average price of residential dwellings in Australia was now $728,500, after rising $21,300 over the quarter.
The total value of Australia’s 10.6 million residential dwellings rose by $257.9 billion to $7.72 trillion, the strongest quarterly rise since December 2016.
"The numbers of residential property sales increased in all capital cities apart from Melbourne and Hobart during 2020. The strongest increases were observed in Perth, Canberra, Sydney and Brisbane," Ms Marquardt said.
According to CoreLogic, home values spiked 2.1% in February alone, the largest month-on-month change in 17 years.
New owner-occupier loans and interest-only loans spike
According to the Australian Prudential Regulation Authority (APRA), new owner-occupier loans were up 23.6% between December 2019 and December 2020, from $71.9 billion to $88.9 billion.
Interest-only loans spiked even further over the same period, up 31.2% from $18.7 billion to $24.6 billion.
Loans with a Loan to Value Ratio (LVR) greater than 95% increased by 27.4%, albeit from a low base of $1.6 billion to $2.1 billion.
APRA said these increases helped to support steady growth, and was unsure of how lending would unfold as schemes like JobKeeper and HomeBuilder came to an end.
"Overall growth in loans and advances was slow, although housing lending grew moderately, supported by lending to owner-occupiers," they said.
"Despite moderately increased new lending at higher loan-to-valuation ratios and debt-to-income ratios, available indicators do not suggest any material relaxation in housing lending standards, with these metrics remaining broadly in line with historical averages.
"Key measures of asset quality were stable thanks to a range of measures providing support to borrowers, but the outlook is uncertain as support measures change over coming quarters."
According to the ABS, owner-occupier numbers in January were up over 70% more than what was seen at the same time last year, with first-home buyers accounting for 36.5% of all owner-occupier loans written in the month.
Photo by Ayush Jain on Unsplash

Ready, Set, Buy!
Learn everything you need to know about buying property – from choosing the right property and home loan, to the purchasing process, tips to save money and more!
With bonus Q&A sheet and Crossword!

 Harry O'Sullivan
 Denise Raward
 Brooke Cooper
 Rachel Horan
 Staff Writers