Top suburbs for rental yield in Victoria


Dominic Beattie
- Group Editor
- Experienced finance editor
- Writer
- Commentator and researcher
Do you like & trust our expert, human-written content?
Simply click this button to tell Google you want to see more of us in your Google Search Results, AI Overviews and AI Mode answers.
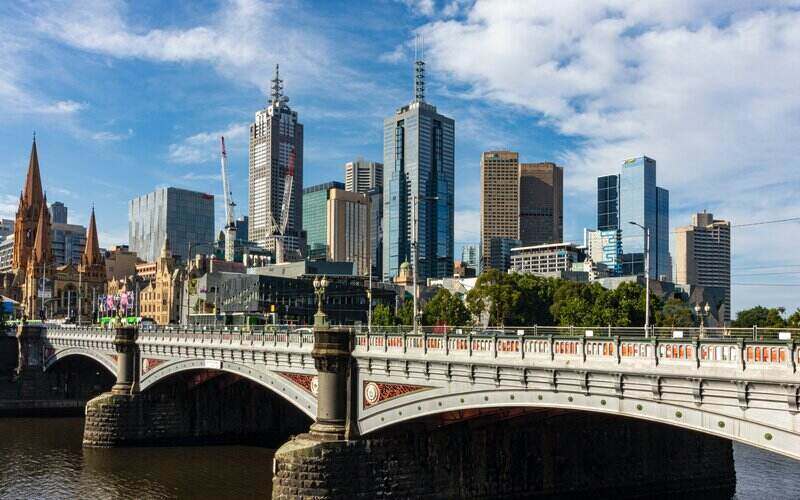
The outlook for property investors in Victoria has been put under the microscope recently. The Property Investment Professionals of Australia judged Victoria the worst of all eight states and territories for property investors after new land taxes were introduced in 2023. According to some research, since then there's been a surge in Victorian investors selling up.
Victoria remains an enduringly appealing place to live though, with Melbourne frequently ranking very well in lists of the most liveable cities in the world. If you're an investor interested in Australia's second most-populated state, these suburbs and towns have some of the highest rental yields.
Victoria rental yields in 2026
| Median price | Median weekly rent | Median rental yield | |
|---|---|---|---|
| Houses (Melbourne) | $890,000 | $575 | 3.5% |
| Units (Melbourne) | $640,000 | $570 | 4.8% |
| Houses (Rest of Victoria) | $595,000 | $490 | 4.4% |
| Units (Rest of Victoria) | $440,000 | $410 | 5.0% |
Source: CoreLogic. Data reported to the period ending October '25. Median values account for sales transactions over three months.
Rental yields in Victoria, in both metropolitan and country areas, are comparatively lower than most other regions. Sydney is the only capital city with lower rental yields for houses than Melbourne at 3.5%, while yields for houses in rural Victoria are above only regional NSW and Tasmania.
Part of this is likely due to the Victorian economy, which is more services-based than the likes of WA and Queensland. One of the biggest drivers of high rental yields is the population of transient workers, which is often relatively high in areas where the main industry is mining or agriculture. The high yields in regional Western Australia, for example, are often in resource rich areas, where workers temporarily live during mining projects, driving up rental demand, but without an equivalent demand for owner occupied property.
It's also worth keeping in mind that the land taxes and absentee owner surcharges need to be factored in when considering the overall return from the property. Rental yields might represent some of the property's value, but this could be offset by it being more expensive annually to own an investment property in Victoria compared to elsewhere.
Read more: Top rental yields in Australia
Highest rental yields in Victoria
The suburb with the highest average rental yield for houses in Victoria as of April was Echuca at 10.6%. For units it was Melbourne City at 8.6%.
Houses
| Rank | Suburb (Postcode) | LGA | Median Price | Median Rent | Gross Rental Yield |
|---|---|---|---|---|---|
| 1st | Echuca (3564) | Campaspe | $578,000 | $1,178 | 10.6% |
| 2nd | Warracknabeal (3393) | Yarriambiack | $225,000 | $340 | 7.9% |
| 3rd | Ouyen (3490) | Mildura | $255,000 | $340 | 6.9% |
| 4th | East Bairnsdale (3875) | East Gippsland | $375,000 | $470 | 6.5% |
| 5th | Golden Beach (3851) | Wellington | $310,000 | $385 | 6.5% |
| 6th | Merbein (3505) | Mildura | $395,500 | $478 | 6.3% |
| 7th | Nhill (3418) | Hindmarsh | $260,000 | $310 | 6.2% |
| 8th | Donald (3480) | Buloke | $277,500 | $330 | 6.2% |
| 9th | Mortlake (3272) | Moyne | $330,000 | $390 | 6.1% |
| 10th | Stawell (3380) | Northern Grampians | $345,000 | $400 | 6.0% |
| 11th | Lucknow (3875) | East Gippsland | $480,000 | $540 | 5.9% |
| 12th | Mooroopna (3629) | Greater Shepparton | $447,000 | $498 | 5.8% |
| 13th | Morwell (3840) | Latrobe | $360,000 | $400 | 5.8% |
| 14th | Cobram (3644) | Moira | $429,500 | $475 | 5.8% |
| 15th | Tatura (3616) | Greater Shepparton | $485,000 | $535 | 5.7% |
| 16th | Red Cliffs (3496) | Mildura | $411,500 | $450 | 5.7% |
| 17th | Churchill (3842) | Latrobe | $387,500 | $420 | 5.6% |
| 18th | Numurkah (3636) | Moira | $410,000 | $440 | 5.6% |
| 19th | Portland (3305) | Glenelg | $420,000 | $450 | 5.6% |
| 20th | Euroa (3666) | Strathbogie | $470,000 | $500 | 5.5% |
| 21st | Rosedale (3847) | Wellington | $439,000 | $465 | 5.5% |
| 22nd | Moe (3825) | Latrobe | $380,000 | $400 | 5.5% |
| 23rd | Seymour (3660) | Mitchell | $432,000 | $450 | 5.4% |
| 24th | Swan Hill (3585) | Swan Hill | $485,000 | $505 | 5.4% |
| 25th | Rutherglen (3685) | Indigo | $560,000 | $580 | 5.4% |
Source: CoreLogic. Data reported to the period ending October 2025. Median values account for sales transactions over 12 months.
Farming is the major theme of the above list. Echuca, Warracknabeal, and Ouyen are all agricultural centres, which can mean higher rental yields as there’s more of a demand for temporary accommodation as workers come and go. There are several other suburbs in this list in the Mildura region, known as the centre of Victoria’s 'Fruit Bowl'.
Units
| Rank | Suburb (Postcode) | LGA | Median Price | Median Rent | Median Rental Yield |
|---|---|---|---|---|---|
| 1st | Melbourne (3000) | Melbourne | $409,444 | $650 | 8.3% |
| 2nd | Seymour (3660) | Mitchell | $233,000 | $360 | 8.0% |
| 3rd | Carlton (3053) | Melbourne | $360,000 | $550 | 7.9% |
| 4th | Travancore (3032) | Moonee Valley | $360,000 | $520 | 7.5% |
| 5th | Southbank (3006) | Melbourne | $490,000 | $680 | 7.2% |
| 6th | Albion (3020) | Brimbank | $287,500 | $385 | 7.0% |
| 7th | West Melbourne (3003) | Melbourne | $450,000 | $600 | 6.9% |
| 8th | Notting Hill (3168) | Monash | $420,000 | $550 | 6.8% |
| 9th | Ararat (3377) | Ararat | $274,250 | $340 | 6.4% |
| 10th | Cairnlea (3023) | Brimbank | $413,650 | $510 | 6.4% |
| 11th | North Melbourne (3051) | Melbourne | $475,000 | $575 | 6.3% |
| 12th | Essendon North (3041) | Moonee Valley | $406,000 | $490 | 6.3% |
| 13th | Kyabram (3620) | Campaspe | $320,000 | $380 | 6.2% |
| 14th | Mernda (3754) | Whittlesea | $415,000 | $490 | 6.1% |
| 15th | Traralgon (3844) | Latrobe | $315,000 | $370 | 6.1% |
| 16th | California Gully (3556) | Greater Bendigo | $350,000 | $410 | 6.1% |
| 17th | Tatura (3616) | Greater Shepparton | $300,000 | $350 | 6.1% |
| 18th | Sale (3850) | Wellington | $326,000 | $380 | 6.1% |
| 19th | Mildura (3500) | Mildura | $340,000 | $395 | 6.0% |
| 20th | Hamilton (3300) | Southern Grampians | $305,000 | $352.5 | 6.0% |
| 21st | Docklands (3008) | Melbourne | $595,000 | $685 | 6.0% |
| 22nd | Portland (3305) | Glenelg | $325,000 | $370 | 5.9% |
| 23rd | Footscray (3011) | Maribyrnong | $462,500 | $525 | 5.9% |
| 24th | St Kilda (3182) | Port Phillip | $490,000 | $550 | 5.8% |
| 25th | Parkville (3052) | Melbourne | $478,000 | $535 | 5.8% |
Source: CoreLogic. Data reported to the period ending October 2025. Median values account for sales transactions over 12 months.
Melbourne City had the highest yields for units in Victoria at 8.3%. Several other suburbs in inner Melbourne made the list, which is slightly unusual given the strongest yields in most other states are generally outside of the capital. What you’ll also notice upon further analysis is this is mostly due to the lower prices of Melbourne units compared to Brisbane and Sydney. It’s not obvious why this is - one contributing factor may be a higher concentration of smaller, one bedroom units in Melbourne compared to other cities.
Highest rental yields in Melbourne
Lang Lang houses, about 70kms south east of the CBD, had an average rental yield of 4.9% as of October, making it the highest in Melbourne. Meanwhile Melbourne City took top spot for units with an 8.3% average yield.
Houses
| Rank | Suburb (Postcode) | LGA | Median Price | Median Rent | Median Rental Yield |
|---|---|---|---|---|---|
| 1st | Lang Lang (3984) | Cardinia | $715,000 | $670 | 4.9% |
| 2nd | Junction Village (3977) | Casey | $670,000 | $620 | 4.8% |
| 3rd | Olinda (3788) | Yarra Ranges | $940,000 | $803 | 4.4% |
| 4th | Dallas (3047) | Hume | $580,000 | $493 | 4.4% |
| 5th | Koo Wee Rup (3981) | Cardinia | $710,000 | $600 | 4.4% |
| 6th | Campbellfield (3061) | Hume | $655,000 | $550 | 4.4% |
| 7th | Wollert (3750) | Whittlesea | $700,000 | $580 | 4.3% |
| 8th | Diggers Rest (3427) | Melton | $629,000 | $520 | 4.3% |
| 9th | Cranbourne South (3977) | Casey | $787,500 | $650 | 4.3% |
| 10th | Clyde (3978) | Casey | $705,500 | $580 | 4.3% |
| 11th | Cranbourne West (3977) | Casey | $710,000 | $580 | 4.2% |
| 12th | Clyde North (3978) | Casey | $737,500 | $600 | 4.2% |
| 13th | Cranbourne East (3977) | Casey | $730,000 | $588 | 4.2% |
| 14th | Melton (3337) | Melton | $510,000 | $410 | 4.2% |
| 15th | Coolaroo (3048) | Hume | $610,500 | $490 | 4.2% |
| 16th | Tarneit (3029) | Wyndham | $661,000 | $530 | 4.2% |
| 17th | Bonnie Brook (3335) | Melton | $639,950 | $513 | 4.2% |
| 18th | Meadow Heights (3048) | Hume | $663,000 | $530 | 4.2% |
| 19th | Kalkallo (3064) | Hume | $630,000 | $500 | 4.1% |
| 20th | Officer (3809) | Cardinia | $750,000 | $595 | 4.1% |
| 21st | Tullamarine (3043) | Hume | $770,000 | $610 | 4.1% |
| 22nd | Pakenham (3810) | Cardinia | $695,000 | $550 | 4.1% |
| 23rd | Sunbury (3429) | Hume | $683,000 | $540 | 4.1% |
| 24th | Doveton (3177) | Casey | $620,000 | $490 | 4.1% |
| 25th | Skye (3977) | Frankston | $810,000 | $640 | 4.1% |
Source: CoreLogic. Data reported to the period ending October 2025. Median values account for sales transactions over 12 months.
Units
| Rank | Suburb (Postcode) | LGA | Median Price | Median Rent | Median Rental Yield |
|---|---|---|---|---|---|
| 1st | Melbourne (3000) | Melbourne | $409,444 | $650 | 8.3% |
| 2nd | Carlton (3053) | Melbourne | $360,000 | $550 | 7.9% |
| 3rd | Travancore (3032) | Moonee Valley | $360,000 | $520 | 7.5% |
| 4th | Southbank (3006) | Melbourne | $490,000 | $680 | 7.2% |
| 5th | Albion (3020) | Brimbank | $287,500 | $385 | 7.0% |
| 6th | West Melbourne (3003) | Melbourne | $450,000 | $600 | 6.9% |
| 7th | Notting Hill (3168) | Monash | $420,000 | $550 | 6.8% |
| 8th | Cairnlea (3023) | Brimbank | $413,650 | $510 | 6.4% |
| 9th | North Melbourne (3051) | Melbourne | $475,000 | $575 | 6.3% |
| 10th | Essendon North (3041) | Moonee Valley | $406,000 | $490 | 6.3% |
| 11th | Mernda (3754) | Whittlesea | $415,000 | $490 | 6.1% |
| 12th | Docklands (3008) | Melbourne | $595,000 | $685 | 6.0% |
| 13th | Footscray (3011) | Maribyrnong | $462,500 | $525 | 5.9% |
| 14th | St Kilda (3182) | Port Phillip | $490,000 | $550 | 5.8% |
| 15th | Parkville (3052) | Melbourne | $478,000 | $535 | 5.8% |
| 16th | Williams Landing (3027) | Wyndham | $447,500 | $500 | 5.8% |
| 17th | Abbotsford (3067) | Yarra | $520,000 | $580 | 5.8% |
| 18th | Wantirna South (3152) | Knox | $531,000 | $590 | 5.8% |
| 19th | Melbourne (3004) | Port Phillip | $590,000 | $650 | 5.7% |
| 20th | South Melbourne (3205) | Port Phillip | $585,000 | $640 | 5.7% |
| 21st | Kensington (3031) | Melbourne | $505,000 | $550 | 5.7% |
| 22nd | Collingwood (3066) | Yarra | $625,000 | $680 | 5.7% |
| 23rd | South Yarra (3141) | Stonnington | $560,500 | $600 | 5.6% |
| 24th | Brunswick East (3057) | Moreland | $538,000 | $575 | 5.6% |
| 25th | Maribyrnong (3032) | Maribyrnong | $495,000 | $520 | 5.5% |
Source: CoreLogic. Data reported to the period ending October 2025. Median values account for sales transactions over 12 months.
Looking for an investment property? Here are some of the top investment home loans available on the Australian market right now
| Lender | Home Loan | Interest Rate | Comparison Rate* | Monthly Repayment | Repayment type | Rate Type | Offset | Redraw | Ongoing Fees | Upfront Fees | Max LVR | Lump Sum Repayment | Extra Repayments | Split Loan Option | Tags | Features | Link | Compare | Promoted Product | Disclosure |
|---|---|---|---|---|---|---|---|---|---|---|---|---|---|---|---|---|---|---|---|---|
6.49% p.a. | 6.53% p.a. | $3,157 | Principal & Interest | Variable | $0 | $530 | 90% |
| Promoted | Disclosure | ||||||||||
6.29% p.a. | 6.20% p.a. | $3,092 | Principal & Interest | Variable | $0 | $0 | 80% |
| Promoted | Disclosure | ||||||||||
6.39% p.a. | 6.41% p.a. | $3,124 | Principal & Interest | Variable | $0 | $350 | 60% |