What is the inflation rate in Australia?


Dominic Beattie
- Group Editor
- Experienced finance editor
- Writer
- Commentator and researcher
Do you like & trust our expert, human-written content?
Simply click this button to tell Google you want to see more of us in your Google Search Results, AI Overviews and AI Mode answers.
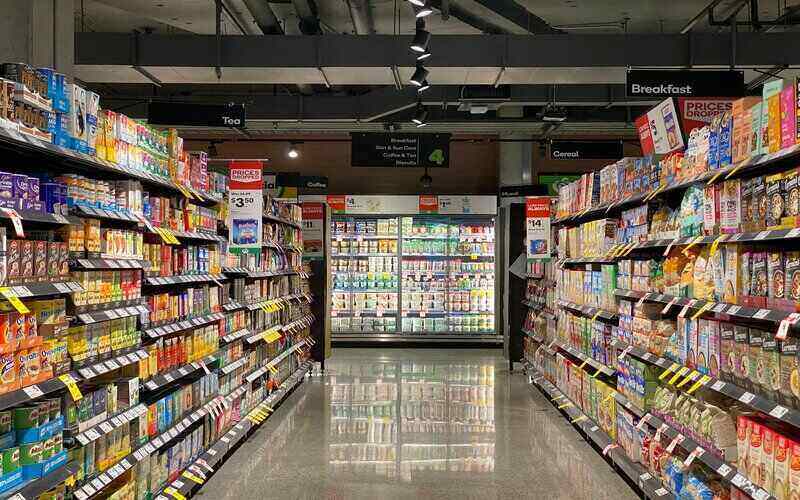
Most people will at some point have seen a politician of some description ranting about inflation. More than a political buzzword though, inflation can shape everything in the economy, from the price of apples to interest rates.
On this page you'll discover the current rates of inflation in Australia, plus some background on exactly what inflation is, how it works and why it matters.
Inflation rate in Australia
As of the June 2025 quarter, the headline annual rate of inflation in Australia is 2.1%. This means Australian prices were 2.1% higher on average than the same quarter in 2024.
Inflation in Australia is measured by the Consumer Price Index (CPI) from the ABS, which has both a monthly and a quarterly series that provide slightly different rates of inflation. It measures the price change of a wide range of goods and services (a 'basket') considered representative of the economy as a whole.
The quarterly series is considered the more reliable indicator, given its dataset is more comprehensive, however the ABS plans to expand the monthly series to the extent that it can eventually replace the quarterly series.
The recent peak of headline inflation in Australia was 7.8% over the 12 months to December 2022 (quarterly series).
CPI Headline Inflation
| Date | Annual CPI inflation | Quarterly |
|---|---|---|
| Jun-2012 | 1.1% | 0.5% |
| Sep-2012 | 1.6% | 1.4% |
| Dec-2012 | 1.7% | 0.2% |
| Mar-2013 | 2.2% | 0.4% |
| Jun-2013 | 2.2% | 0.4% |
| Sep-2013 | 1.7% | 1.2% |
| Dec-2013 | 2.3% | 0.8% |
| Mar-2014 | 2.6% | 0.6% |
| Jun-2014 | 2.2% | 0.5% |
| Sep-2014 | 2.0% | 0.5% |
| Dec-2014 | 1.2% | 0.2% |
| Mar-2015 | 0.6% | 0.2% |
| Jun-2015 | 0.8% | 0.7% |
| Sep-2015 | 0.6% | 0.5% |
| Dec-2015 | 0.7% | 0.4% |
| Mar-2016 | 1.0% | -0.2% |
| Jun-2016 | 0.8% | 0.4% |
| Sep-2016 | 1.4% | 0.7% |
| Dec-2016 | 1.8% | 0.5% |
| Mar-2017 | 2.3% | 0.5% |
| Jun-2017 | 2.1% | 0.2% |
| Sep-2017 | 2.1% | 0.6% |
| Dec-2017 | 2.2% | 0.6% |
| Mar-2018 | 2.4% | 0.4% |
| Jun-2018 | 2.8% | 0.4% |
| Sep-2018 | 2.5% | 0.4% |
| Dec-2018 | 2.5% | 0.5% |
| Mar-2019 | 1.8% | 0.0% |
| Jun-2019 | 1.7% | 0.6% |
| Sep-2019 | 1.8% | 0.5% |
| Dec-2019 | 1.7% | 0.7% |
| Mar-2020 | 2.0% | 0.3% |
| Jun-2020 | -0.6% | -1.9% |
| Sep-2020 | 1.0% | 1.6% |
| Dec-2020 | 1.1% | 0.9% |
| Mar-2021 | 1.6% | 0.6% |
| Jun-2021 | 4.8% | 0.8% |
| Sep-2021 | 3.7% | 0.8% |
| Dec-2021 | 4.0% | 1.3% |
| Mar-2022 | 5.4% | 2.1% |
| Jun-2022 | 6.1% | 1.8% |
| Sep-2022 | 7.3% | 1.8% |
| Dec-2022 | 7.8% | 1.9% |
| Mar-2023 | 7.0% | 1.4% |
| Jun-2023 | 6.0% | 0.8% |
| Sep-2023 | 5.4% | 1.2% |
| Dec-2023 | 4.1% | 0.6% |
| Mar-2024 | 3.6% | 1.0% |
| Jun-2024 | 3.8% | 1.0% |
| Sep-2024 | 2.8% | 0.2% |
| Dec-2024 | 2.4% | 0.2% |
| Mar-2025 | 2.4% | 0.9% |
| Jun-2025 | 2.1% | 0.7% |
Underlying inflation
Another important measurement of inflation is underlying or trimmed mean inflation. This excludes the components of the CPI with traditionally volatile prices - think food and fuel. Underlying inflation is sometimes considered a more accurate representation of how the economy is tracking than the headline rate.
Underlying CPI inflation
| Date | Annual | Quarterly |
|---|---|---|
| Jun-2012 | 2.0% | 0.5% |
| Sep-2012 | 2.3% | 0.7% |
| Dec-2012 | 2.2% | 0.5% |
| Mar-2013 | 2.3% | 0.5% |
| Jun-2013 | 2.4% | 0.6% |
| Sep-2013 | 2.4% | 0.7% |
| Dec-2013 | 2.7% | 0.8% |
| Mar-2014 | 2.7% | 0.5% |
| Jun-2014 | 2.8% | 0.7% |
| Sep-2014 | 2.4% | 0.4% |
| Dec-2014 | 2.2% | 0.6% |
| Mar-2015 | 2.3% | 0.6% |
| Jun-2015 | 2.2% | 0.6% |
| Sep-2015 | 2.1% | 0.3% |
| Dec-2015 | 2.1% | 0.6% |
| Mar-2016 | 1.7% | 0.2% |
| Jun-2016 | 1.6% | 0.5% |
| Sep-2016 | 1.6% | 0.3% |
| Dec-2016 | 1.5% | 0.4% |
| Mar-2017 | 1.7% | 0.5% |
| Jun-2017 | 1.7% | 0.5% |
| Sep-2017 | 1.7% | 0.4% |
| Dec-2017 | 1.7% | 0.4% |
| Mar-2018 | 1.7% | 0.5% |
| Jun-2018 | 1.6% | 0.4% |
| Sep-2018 | 1.7% | 0.4% |
| Dec-2018 | 1.8% | 0.5% |
| Mar-2019 | 1.6% | 0.3% |
| Jun-2019 | 1.6% | 0.4% |
| Sep-2019 | 1.5% | 0.4% |
| Dec-2019 | 1.5% | 0.4% |
| Mar-2020 | 1.7% | 0.5% |
| Jun-2020 | 1.2% | -0.1% |
| Sep-2020 | 1.2% | 0.3% |
| Dec-2020 | 1.2% | 0.5% |
| Mar-2021 | 1.1% | 0.3% |
| Jun-2021 | 1.6% | 0.4% |
| Sep-2021 | 2.1% | 0.8% |
| Dec-2021 | 2.7% | 1.0% |
| Mar-2022 | 3.8% | 1.5% |
| Jun-2022 | 5.0% | 1.5% |
| Sep-2022 | 6.1% | 1.9% |
| Dec-2022 | 6.8% | 1.7% |
| Mar-2023 | 6.5% | 1.2% |
| Jun-2023 | 5.8% | 0.9% |
| Sep-2023 | 5.1% | 1.2% |
| Dec-2023 | 4.2% | 0.9% |
| Mar-2024 | 4.0% | 1.0% |
| Jun-2024 | 4.0% | 0.8% |
| Sep-2024 | 3.6% | 0.8% |
| Dec-2024 | 3.2% | 0.5% |
| Mar-2025 | 2.9% | 0.7% |
| Jun-2025 | 2.7% | 0.6% |
How the RBA impacts inflation
Along with preserving employment, managing inflation is one of the two priorities of the Reserve Bank of Australia (RBA). If inflation is too high, the RBA can try to bring it down by increasing the cash rate (thereby increasing interest rates on home loans, car loans, business loans, savings accounts, term deposits etc.) which generally encourages consumers and businesses to save more and spend less.
The RBA targets annual inflation of between two and three percent, and the cash rate is its main weapon for keeping it within this range.
The inflation target
It seems counter intuitive but the inflation target is not 0%. Prices going up means demand is ahead of supply, which implies opportunities for the economy to grow. Flat prices also means it takes just a little negative shock to the economy to send prices falling, known as deflation. Again, this might not sound like a bad thing, but deflation generally also means an economic downturn. It can discourage spending as consumers and businesses hold off on purchases in hope prices will fall further still, which is similarly bad for the economy like the above hyperinflation scenario.
Inflation in Australia by spending category
While the underlying inflation rate is often what the RBA pays most attention to, for many people inflation is felt more specifically than generally. Here's how inflation is tracking in some of the most prominent spending categories.
Grocery price inflation
Coles and Woolworths are where many Aussies feel the pinch of inflation most acutely. When grocery prices are raising faster than wage growth, it means people are having to devote a higher proportion of their income to buying food. This reduces the amount of money they have to spend on other things, or force people to cut back on how much food they are buying.
As of June 2025, annual 'food and non-alcoholic beverage' price inflation was 3%. That's still just above the target level, but down significantly from the peaks of 2022 and 2023.
Since 2023 Savings.com.au, has had its own index tracking grocery prices. While not as comprehensive as the ABS CPI, it offers a product by product breakdown which can be illuminating. See for example how the price of eggs has changed since November 2023.
| Coles | Annual change | Woolies | Annual change | Average | Annual change | |
|---|---|---|---|---|---|---|
| August '25 | $6.20 | 19.2% | $6.20 | 19.2% | $6.20 | 19.2% |
| July '25 | $6.20 | 19.2% | $6.20 | 19.2% | $6.20 | 19.2% |
| June '25 | $6.20 | 19.2% | $6.20 | 19.2% | $6.20 | 19.2% |
| May '25 | $6.20 | 19.2% | $6.20 | 19.2% | $6.20 | 19.2% |
| April '25 | $6.20 | 19.2% | $6.20 | 19.2% | $6.20 | 19.2% |
| March '25 | $5.70 | 9.6% | $5.70 | 9.6% | $5.70 | 9.6% |
| February '25 | $5.70 | 9.6% | Out of stock | 9.6% | $5.70 | 9.6% |
| January '25 | $5.70 | 9.6% | $5.70 | 9.6% | $5.70 | 9.6% |
| December '24 | $5.70 | 9.6% | $5.90 | 13.5% | $5.80 | 11.5% |
| November '24 | $5.70 | 9.6% | $5.70 | 9.6% | $5.70 | 9.6% |
| October '24 | $5.70 | $5.70 | $5.70 | |||
| September '24 | $5.70 | $5.70 | $5.70 | |||
| August '24 | $5.20 | $5.20 | $5.20 | |||
| July '24 | $5.20 | $5.20 | $5.20 | |||
| June '24 | $5.20 | $5.20 | $5.20 | |||
| May '24 | $5.20 | $5.20 | $5.20 | |||
| April '24 | $5.20 | $5.20 | $5.20 | |||
| March '24 | $5.20 | $5.20 | $5.20 | |||
| February '24 | $5.20 | $5.20 | $5.20 | |||
| January '24 | $5.20 | $5.20 | $5.20 | |||
| December '23 | $5.20 | $5.20 | $5.20 | |||
| November '23 | $5.20 | $5.20 | $5.20 |
Read more: Grocery price index
Transport price inflation
Transport in the CPI includes buying or renting a vehicle, running costs and other forms of transport like Taxi fares. As the price of fuel can be erratic, the cost of transport jumps around as well. Throughout 2021 and 2022 annual inflation was often above 10%, peaking at nearly 14% over the year to March 2022. As of June 2025 though, the annual transport inflation rate was actually down 2.5 percentage points from a year prior.
Property price inflation
Since property is often an appreciating asset, price inflation generally isn't spoken about in the same terms as consumable goods. After all, for people who already own property, prices going up is usually a good thing.
Nonetheless, property prices over the past few decades have increased at a rate well above both wages and overall inflation, implying it's become harder in real terms to buy. As of July 2025, the Cotality Home Value Index (HVI) estimated the median dwelling price in Australia was $844,000 - up 3.7% on the year before and an all time record.
Property price growth tends to fluctuate in different areas. For example, over the five year period to July 2025, prices in Melbourne rose by an average 15.6%. Over the same period, prices in Perth lifted 82%.
What is inflation?
Inflation measures how fast prices are increasing. A 3% annual inflation rate means, on average, goods and services are 3% more expensive than the same time a year prior. It's one of the most important considerations for policymakers including the federal government and the RBA. If prices are rising faster than wages, it means that people's real income (their actual purchasing power) is getting worse. Inflation can also erode confidence in the economy - it's "corrosive" as RBA Governor Michele Bullock likes to say.
What is hyperinflation?
Too high inflation for too long can cause "hyperinflation" which happens when consumers come to expect rapid price increases. The logical thing to do then is to spend more now since money will be worth a lot less in the future - which pushes prices higher still in a "hyperinflationary spiral" which has happened in the recent past in countries like Venezuela and Argentina. In extreme cases, hyperinflation can render a currency close to worthless
What causes inflation?
Inflation is often simplified down to "too much money chasing too few goods". Here's a silly example to get your head around how this works:
Imagine you give everyone in Australia $10 million. Does that mean everyone can now buy waterfront property in Sydney and a Lamborghini? It doesn't, because the supply of these things hasn't changed. There's still the same number of houses in Bellevue Hill and Point Piper as before, so the price would simply increase to a new level still only affordable to the absolute richest among us. This would happen on a smaller scale to the cost of every good or service.
The RBA groups the major causes of inflation into three categories: demand-pull inflation, cost-push inflation, and inflation expectations.
Demand pull inflation
Demand pull inflation means the aggregate demand for goods and services is increasing relative to the supply, like the above example.
As demand goes up, businesses can respond by increasing prices, since more demand means more willingness to pay higher prices. Businesses may also seek to increase their output to meet the extra demand. This might mean hiring more workers, pushing up wages, which increases consumer demand and can push up prices. If that sounds like economic growth to you, you're right - that's partly why the inflation target is 2-3%, not 0. When demand pull inflation is too great however, demand for goods and services is beyond the economy's capacity to expand supply, and price growth can get out of control.
Demand pull inflation can come from changing consumer preferences, an oversupply of money, or an increase in net exports among other things. Some economists believe inflation in Australia in the early 2020s was partly down to the RBA overstimulating the economy - printing too much money through quantitative easing.
Cost push inflation
Cost-push inflation is the opposite, inflation from the supply side. The aggregate supply of goods and services decreases relative to demand. Imagine 50% of the existing prestige houses in Sydney are demolished - the price of those that reman would likely increase dramatically.
It's known as 'cost-push' inflation because this is often caused on an aggregate level by increases in the cost of production. Say the price of petrol - determined by international markets - suddenly increases. This makes it more expensive for a company to transport its goods, its 'input costs' have gone up. As input costs like fuel, wages or raw materials increase, companies tend to pass on the cost to consumers, but what also can happen is companies lower their output, reducing the supply of goods available and pushing up demand.
A recent example of cost push inflation was the surge in oil and gas prices on the back of Russia's invasion of Ukraine, contributing to runaway inflation in the prices of other goods due to the higher input costs of shipping and manufacturing.
Inflation expectations
As we touched on earlier, it can also be inflationary if households and businesses come to expect rapid inflation in future. The rational response to such expectations is to buy more in the short term, before prices go up, which causes demand-pull inflation.