
- Buying a first home continues to get harder, a Domain report has found
- Deteriorating affordability is being driven more by growth in entry-level prices than interest rates alone
- It is taking longer to save for a 20% deposit in almost all markets while those managing to buy are increasingly facing mortgage stress
First homebuyers in Australia face the dual affordability constraints of taking longer to save for a deposit and realising higher repayments once they buy a home.
Domain's First Homebuyer Report, released on Thursday, found first home affordability is being reshaped more by growth in entry-level prices and less by interest rates alone.
As a result, saving for a deposit is taking longer in most markets while mortgage repayments remain elevated for those who manage to buy.
See also :
Sydney the hardest market, Brisbane close behind
Sydney continues to record the longest time needed to save for entry-priced houses, followed by Brisbane, Adelaide, and Perth.
The fallback of buying a unit is also breaking down in some capitals, the report found.
For the first time, Brisbane has overtaken Sydney as needing the longest time to save for an entry-priced unit.
Unit prices have also rapidly escalated in Adelaide and Perth, indicating apartments are no longer providing relief for first homebuyers.
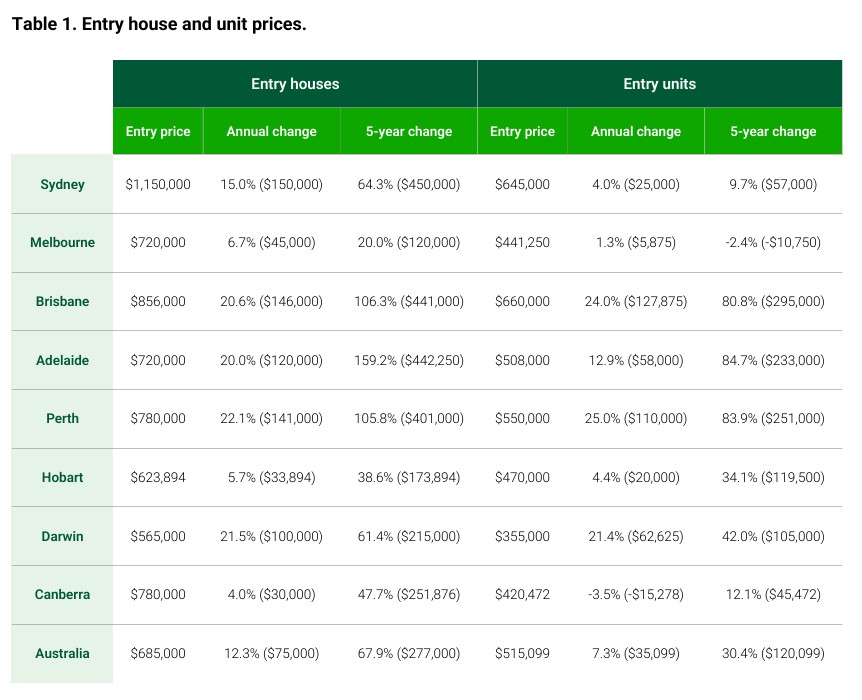
The table below tracks entry-level house and unit prices over the past 12 months and five years in the capital cities and nationally:
City-by-city breakdown
Perth, Brisbane, and Adelaide recorded the strongest annual increases, each seeing more than 20% annual growth in house prices.
All three cities also saw more than 80% unit price growth over the past five years.
Perth's unit prices jumped 25% in a year while Brisbane's were close behind at 24%.
Sydney also recorded 15% growth in house prices and remains the only capital city where an entry-level house exceeds $1 million.
Both Melbourne and Canberra saw more modest house and unit price growth, allowing income growth to partially offset rising prices.
Home prices outstripping wages
The report found entry-level house prices have increased by 68% nationally over the past five years while entry-level units have risen by 30%.
Both figures outstrip the 23% increase in inflation over the same period, while wages have risen 21%, as illustrated below:
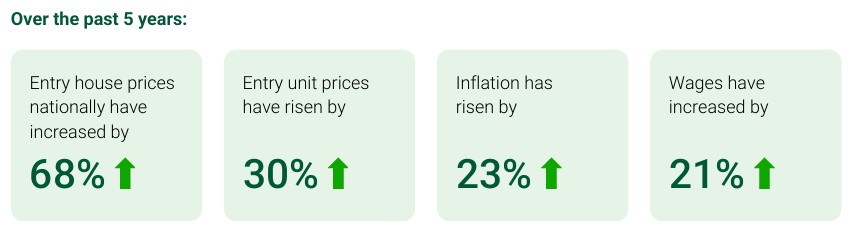
The report said the divergence between housing costs and incomes has widened the gap between household saving capacity and the upfront cost of entering the market, particularly for houses.
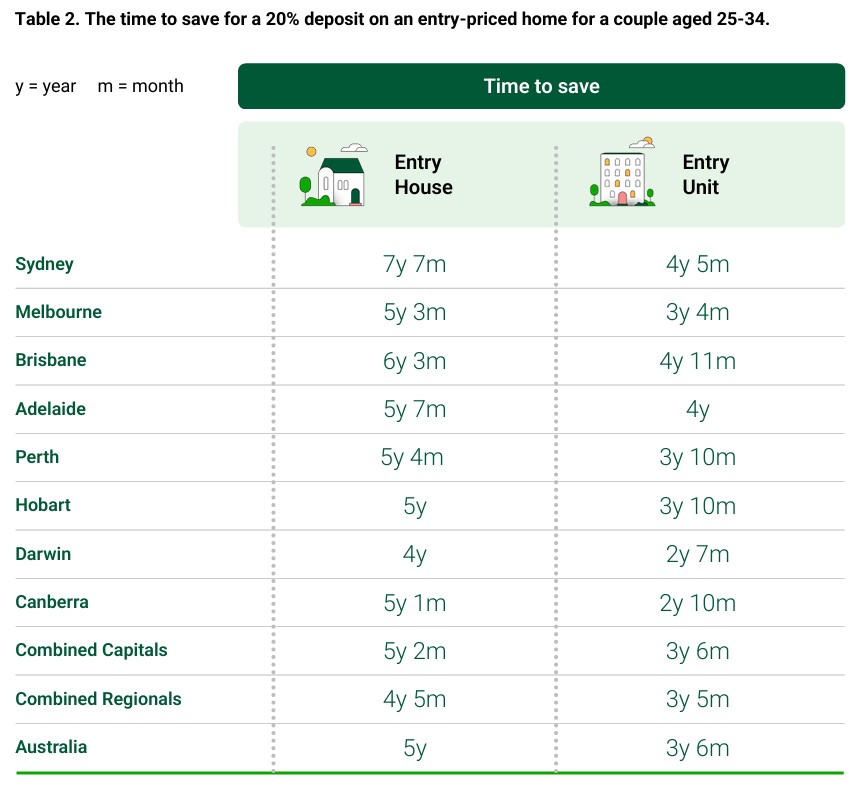
The time required to save a 20% home deposit varies widely between the capital cities with Sydney leading the way with 7.7 years needed for an entry-priced house while 2.7 years is required for an entry-level unit in Darwin.
Mid-sized capitals hit by affordability crisis
Brisbane has leapt up the ladder, followed by Adelaide and Perth, as rapid entry-level price growth outpaced wage gains in the three mid-sized cities.
At the same time, Melbourne, Canberra, and Hobart have dropped in the national rankings, offering better affordability.
The report found the shifts reflected price growth at the lower end of the housing market rather than changes in interest rates and wages alone.
Savings times increased for entry-priced houses across every capital city and for units in all except Melbourne and Canberra.
Brisbane again led the way for the biggest annual increase in both house and unit deposit savings times, as illustrated below:
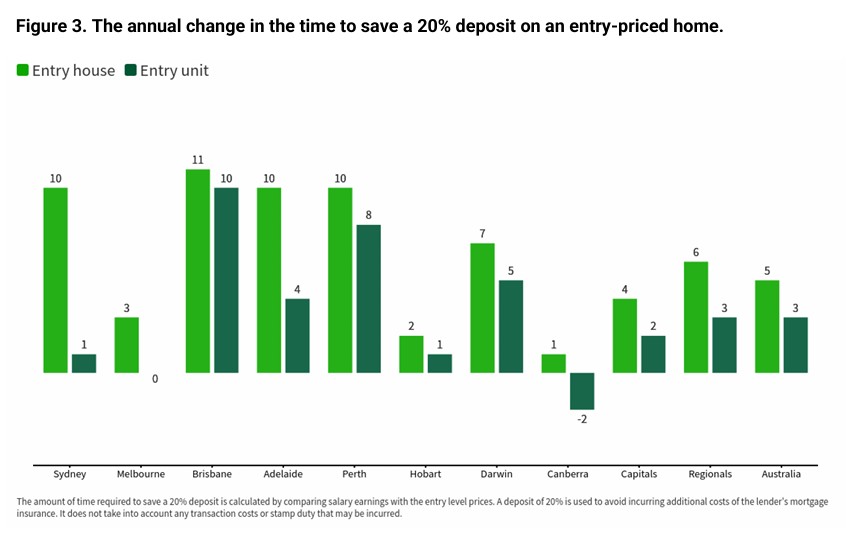
Canberra was the only city to record a drop over the past year - that was in the time needed to save for a unit while the timeframe for Melbourne units remained unchanged.
Over five years, Adelaide, Brisbane, and Perth again led the way.
The data shows all three moved from among the fastest markets in terms of home deposit saving times to among the longest.
Mortgage serviceability also varies widely
Location also plays a role in repaying a home loan, the report found.
Regional Australia provided the most favourable conditions with entry-priced unit repayments accounting for 26.9% of income - below the recognised mortgage stress threshold of 30%.
Entry-price houses in the regions remain above the benchmark at 34.4% but still compared favourably with capital city markets.
Across the combined capitals, entry-priced houses consume 48.9% of household income, while units require 30.9%.
The figure for houses remained well above observed benchmarks for mortgage stress despite three interest rate cuts in 2025.
Mortgage stress on the rise
Sydney carries the heaviest repayment burden for entry-level houses at 61.8% of household income, followed by Brisbane (50%), Adelaide (44%), and Perth (42%).
Units saw more cities fall below the 30% mortgage stress benchmark, including Darwin, Canberra, Melbourne, Hobart, and Perth.
However, buyers purchasing entry-level units carried a greater burden in Brisbane where repayments represented 38.6% of household income, followed by Sydney (34.7%), and Adelaide (31%).
The report found overall, mortgage serviceability deteriorated rapidly with the aggressive cash rate hikes of 2022 and 2023.
The cash rate cuts of 2025 were not enough to offset the combined impact of higher home prices and larger loan sizes.
It was also looking increasingly challenging in light of the February 2026 cash rate increase, the report said, with many analysts forecasting another rate hike later this year.
The Domain analysis concluded the changes point to a structural shift in affordability rather than a temporary cycle driven by interest rates alone.
Advertisement
| Lender | Home Loan | Interest Rate | Comparison Rate* | Monthly Repayment | Repayment type | Rate Type | Offset | Redraw | Ongoing Fees | Upfront Fees | Max LVR | Lump Sum Repayment | Extra Repayments | Split Loan Option | Tags | Features | Link | Compare | Promoted Product | Disclosure |
|---|---|---|---|---|---|---|---|---|---|---|---|---|---|---|---|---|---|---|---|---|
6.19% p.a. | 6.23% p.a. | $3,059 | Principal & Interest | Variable | $0 | $530 | 90% |
| Promoted | Disclosure | ||||||||||
6.14% p.a. | 6.05% p.a. | $3,043 | Principal & Interest | Variable | $0 | $0 | 80% |
| Promoted | Disclosure | ||||||||||
5.99% p.a. | 5.95% p.a. | $2,995 | Principal & Interest | Fixed | $0 | $0 | 60% |
| ||||||||||||
6.23% p.a. | 6.23% p.a. | $3,072 | Principal & Interest | Variable | $0 | $395 | 70% | Disclosure |