Which generation had it harder for home buying?


Dominic Beattie
- Group Editor
- Experienced finance editor
- Writer
- Commentator and researcher
Do you like & trust our expert, human-written content?
Simply click this button to tell Google you want to see more of us in your Google Search Results, AI Overviews and AI Mode answers.

It’s essentially a battle of mortgage serviceability versus housing affordability. The two are better explained in this article here. However, we’re here to add fuel to the fire, to pit Millennials (1980-1995) against Baby Boomers (1945-1964) once again, and determine whose moaning is more justified. Nevertheless, let’s find out who’s had it harder, while also not forgetting about Gen X (1965-1979) along the way, along with a brief mention of Gen Z (1996-2012ish).
Interest Rates & Mortgages
Here’s the thing about interest rates - they’re highly variable. And whenever someone brings up sky-high interest rates as reason for it being harder to service a mortgage in decades past, consider that 17%-ish interest rates were seen only for a few years from around 1987 to 1990. Sky-high interest rates were a catalyst for the 1990s recession, but by 1992, rates had stabilised to about 11% then slid further from there by the mid-90s.
If your timing was unlucky enough that you bought a home during this period, then you’d have a fair cause for complaint.
Assuming Boomer borrowers had a 20% deposit on the average price in 1992 ($121,260), that means you’re borrowing $97,000, totalling a $1,383 monthly mortgage repayment on a 30-year term at 17%. This figure equates to $3,203 in today’s money.
- If borrowers held on for a few years, they could ride out the storm. The late interest rate of 8.75% in 1994 equates to $763 per month ($1,703 in today’s money) - in just two to four years, mortgage payments on the average home price decreased by nearly half.
Baby boomers are also an incredibly wide-ranging generation, with birth years from 1945 to 1964. A lot happened in that span, including unparalleled economic growth post-World War II, and no notable recessions until the oil crisis of the early-1970s. It’s impossible to tar all Boomers with the same brush, though those buying in the late 80s or early 90s understandably would have faced some challenges with the high interest rates.
On the flipside of the coin are Millennials recovering from record low interest rates in 2020-22 to face higher rates today.
Assuming a Millennial borrower had a 20% deposit on the median home price of $889,000, that means they’re borrowing $711,200. Using the the average mortgage rate of 5.50% p.a. today that's $4,038 a month.
- However the average first home buyer loan size is $555,000, suggesting those entering the market are not or cannot borrow for the median home price.
However, 4.52% sounds high - that’s because the Reserve Bank didn’t start measuring discounted variable rates until June 2004. Frankly you’d have to be unlucky to be on the standard variable rate (SVR) these days. For reference, ASIC says the average mortgage rate as of November 2020 is 2.54%.
Who wins this debate?
It’s a wash. If you’re a late Boomer, you’d probably have faced higher interest rates, making any mortgage payments harder to swallow at least for a few years. On the flipside, the Millennial generation has a steeper mortgage repayment thanks to a high home price. While interest rates bottomed out in 2020-22, they rose quickly from there, limiting flexibility.
The risk with younger generations, too, is being saddled with debt while interest rates are at rock bottoms - any increase as we've seen could present a few problems.
If you’re an early Boomer, or a Gen Xer, you’re probably feeling like a winner in this scenario, though buying a home is hardly a cakewalk no matter what your generation.
Who Had It Easier Buying a Home - A Case Study
You can look at data all day, but the person you’re arguing with at the family barbecue isn’t going to see sense. Instead they’re going to use their own experiences to determine which generation had it easier buying a home. To quote Mark Twain, “Never argue with an idiot. They will only bring you down to their level, and beat you with experience”. So let’s look at a case study.
Photo: Harrison Astbury
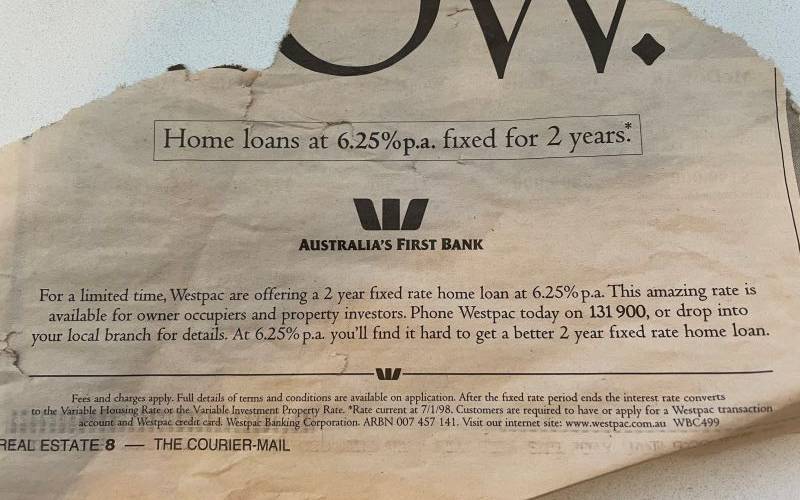
A newspaper clipping from Brisbane’s Courier Mail from 1998 shows some eye-opening information. On one side is a list of newly-built houses, and on the reverse side is a mortgage ad from Westpac. Assuming you were 30 in 1998, that places you in the Gen X generation.
Photo: Harrison Astbury
Let’s focus on the $240,000 ‘pure luxury’ house in Carindale - a suburb about 10km southeast from Brisbane CBD. It’s a nice house in a nice suburban sprawl suburb - four bedrooms and three bathrooms on a land size in excess of 600 sq m. However, $240,000 back then was hardly considered a ‘starter home’, and judging by what it’s worth today, is not a starter home.
If you used the Westpac 6.25% p.a. two year fixed loan (comparison rate unknown), assuming you had a 20% deposit, that’s a $1,182 monthly mortgage repayment in 1998 - or about $2,431 in today’s money.
The Westpac ad also says to consider the extra fees, which this calculation did not account for.
Aside from the real estate ad ‘promising’ 8.5% annual returns, which is decidedly dodgy, the house price estimate today is nearly $2 million, according to Proptrack.
If you again had a 20% deposit ($400,000 - a tough task), the mortgage repayment on the average mortgage rate of 5.50% p.a. would equate to $9,084 a month today.
Wage data is hard to compare among different generations as the Australian Bureau of Statistics has changed its methodology and collection criteria throughout the years. However, based on this rough example, buyers today would be worse off in terms of the monthly payment, as well as building a deposit.
This is assuming they are buying where their parents bought - as property markets mature, choosing homes in the same location is getting harder, and younger homebuyers are either having to choose denser living or buying further out.

Home Prices & Deposits
House prices, and the time it takes to save a deposit, are arguably the bigger factors in the housing affordability debate. This is where younger generations are at a disadvantage, but once they’re in the nightclub (paid for the deposit) they get somewhat better mortgage affordability compared to their ancestors. Boomers and Gen Xers, on the other hand, paid a lower entry fee, but higher fees for drinks and meals once inside the nightclub.
Domain research indicates homebuyers today take upwards of 10 years in some cities to save for a 20% deposit at the median home value.
Traditionally a 20% deposit has been the goal, which is the threshold lenders use to not charge borrowers lenders mortgage insurance (LMI). However the 5% Deposit Scheme aims to slash the time taken to save for a deposit.
However like many government grants and handouts, there are question marks on if they actually address affordability. Instead, it’s argued that the programs induce demand, pushing prices higher.
Who wins this debate?
Younger generations are clear losers in regard to house deposits and saving for one. While there are a lot more government grants these days than there were 30-40-50 years ago, it’s unclear if they actually affect affordability. Handouts help an individual with their own home, but they induce demand, which pushes up prices further.
Savings.com.au's two cents
Buying a home is hardly a walk in the park, no matter how old you are, or which generation you are from. It’s probably the biggest financial decision you’re going to make in your life.
However, the debate today is very black and white, and unnecessarily pits older people against younger people, defined by arbitrary generational brackets. The truth is, there’s a lot of nuance in the debate, because each individual case is different. While you can use averages and all manner of data, they don’t paint a deep enough picture.
So, don't get angry at your forefathers or snot-nosed kids - get angry at the policymakers.
Though, if you were to generalise, later Boomers and very early Gen X had a hard time with high interest rates. Gen Y/Millennials have to deal with much higher house prices, but lower interest rates, which might not be enough to offset the high barrier to entry i.e. obtaining a deposit.
And sandwiched in the middle are Gen Xers, with their nihilistic grunge music from Nirvana and Pearl Jam. They seem to be getting pulled in all directions, with a mixture of slight lack of affordability, hardly-inspiring interest rates, and lack of government handouts. And let’s not forget Gen Z. Sorry kiddo, better make it big on TikTok, because you look screwed.
Earlier Boomers you could argue had a decent blend of moderate interest rates, plus much lower house prices. But the world around the 1960s and 70s was much different back then - many women couldn’t even get a home loan on their own! And even then, it’s not like an earlier Boomer could just walk into a bank and have
Opraha lending specialist go ‘You get a house, you get a house!’The best two cents we can give is to log off social media, and don’t buy into generational debates. If you want a house, ignore everything, and work hard. If you don’t agree with a housing policy, vote accordingly or write to your local Member or Minister. But for now, strap in, and feel the Gs.
Wages & Savings
Wages are incredibly high compared to 30-40 years ago, even accounting for inflation. However, wage growth has slowed since the Global Financial Crisis, with real wages treading water or going backwards for much of the 2010s in the lead up to the post-Covid inflation surge. Wage growth, too, has been led in large part by mining, and financial services - other sectors were more mixed.
Leading up to the COVID-19 pandemic, savings ratios were incredibly low. However, as seen in many crises, households tighten their belts and save for a rainy day. Fiscal stimulus throughout 2020 saw the savings ratio climb to levels not seen since 1974, when the oil crisis was in full swing.
However, one major negative of the low interest environment is that interest rates are lower on traditional savings methods, such as savings accounts and term deposits. This has pushed savers to look at the stockmarket, as Stockspot CEO Chris Brycki explains:
“Younger people need to look at alternative ways of growing their savings … We’ve definitely seen a big spike in enquiries and applications from people who feel frustrated about the returns their savings are getting … For the younger generation saving up, investing is becoming more popular as an alternative to leaving money in the bank. It does come with some extra risks but they can be managed by having a well diversified portfolio, low fees and a time horizon of at least a few years.”
- Stockspot CEO Chris Brycki
Younger generations are more likely to be saddled with student loan debt. Many Baby Boomers received ‘free’ university tuition, with the Whitlam Government abolishing fees in 1974, but it’s also important to note the highest marginal tax bracket as of the early 1980s was 60%.
The advent of compulsory superannuation in the early 1990s also acts as forced savings scheme for retirement, which many Boomers did not get access to for most of their working lives. However, the counter-argument to this is that there is some evidence to suggest higher rates of super equate to lower wage growth - pick your poison.
Employment is another interesting one, with unemployment spiking in the early 1990s thanks to the recession. However, in the 1980s, underemployment was incredibly low, hovering around the 2% mark. Underemployment, which is a measurement of employed people who want more work, has been elevated since about 2008, thanks in part to the gig economy, and changing labour conditions.
Who wins this debate?
Gen X seem to be the biggest losers, with the most justified cause for complaint. Unlucky Gen Xers were hit with high levels of debt, negligible wage growth, and increasing underemployment along with a lower savings ratio, affecting their ability to buy a home. Later Boomers also have a dog in the fight, with lower wages, as well as high unemployment in the late 1980s and early 1990s. In the middle are Millennials, with higher house prices and arguably rockier employment, but by some measures a higher disposable income. Earlier Boomers tended to win out once again, with relatively stable employment and incredibly low underemployment, as well as free university tuition for a large group of people, provided you weren’t drafted into the Vietnam War of course, or looking to buy a home as a single woman!
Dual Income Households
According to Australian Institute of Family Studies (AIFS), just over half the number of parent households earned two incomes in the early 1990s. By the mid-2010s, that figure was more like two-thirds.
An argument to make is that it was harder to buy a home on one income, especially considering the median wage back in 1994 was about $550 or $1,205 (adjusted for inflation). However, there’s problems on the flipside of that argument, too.
In 2016, research house Roy Morgan said: “More than two-thirds (67.2%) of owner-occupied mortgages are now held by households with two incomes, presenting some problems if one decides to either drop out of the workforce or becomes unemployed.”
“This analysis has shown that the loss of an income in a two income-household has more impact than a doubling of interest rates,” Roy Morgan industry communications director Norman Morris said.
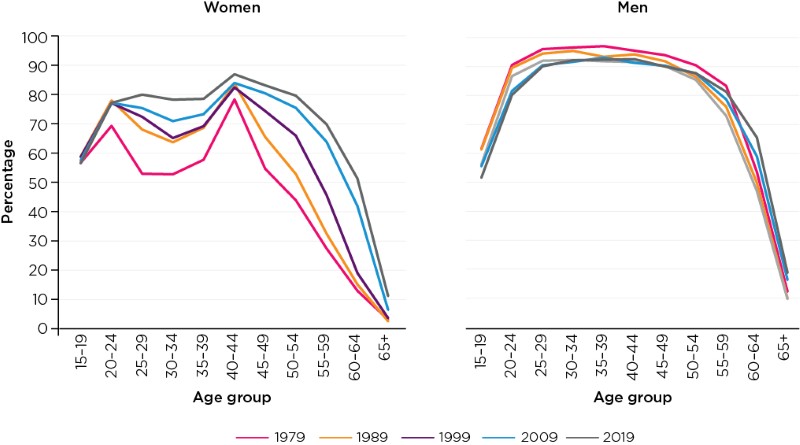
Women still drop out of the workforce in prime fertility years from 25 to 30, however the curve is flattening, as seen in the AIFS-compiled labour force participation breakdown below.
Source: AIFS
If both parents are on full-time wages, the likelihood of paying for childcare increases, too. Childcare is often a significant hit to the budget and can cost upwards of $200 a day in some areas. Governments have aimed to address this through handouts and price caps, but these only seem to induce demand and ultimately prices, further.
In 2004, Elizabeth Warren, more famously known as being a 2020 US presidential candidate, penned a book titled ‘The Two Income Trap’, which opined that dual incomes and rising living costs present a greater risk to households than single incomes.
Ms Warren also argued that dual income families in this generation have less disposable income than single income families a generation ago.
“Even as millions of mothers marched into the workforce, savings declined … Instead, families were swept up in a bidding war, competing furiously with one another for their most important possession: a house in a decent school district,” Ms Warren wrote.
Professor Todd Zywicki in his critique of Ms Warren’s research also opined that the increased tax burden mitigates the effect of two incomes, more so than increased mortgage payments.
“The increase in tax obligations is over three times as large as the increase in the mortgage (the supposed driver of the 'two income trap') and about double the increase in the combined obligations of mortgage and automobile payments,” he said.
“This also leaves aside the peculiarity that the 2000s family is paying $9,670 in new child care and $2,860 in new automobile expenses supposedly to meet a $3,690 increase in mortgage expenses, the supposed driver of the model.”
It’s important to note that this is a US-focused research, but the same could be argued for Australia, too.
Who wins this debate?
This is decidedly a chicken-or-the-egg debate. While higher house prices may necessitate a dual income, women still leave the workforce in child-rearing years, which could increase risk of mortgage stress. An important note, is that entrenched sexism affected Boomers, as many women were unable to sign a mortgage by themselves without a husband or partner co-signing until the mid-80s. Calling this one a tie.