
- Australia's home values have fallen for a sixth straight month, now 5.2% below the record highs of March
- Brisbane led the monthly decline among the capital cities while Darwin was the only city to see values climb
- Values are now down in 97% of capital city suburbs over the past three months
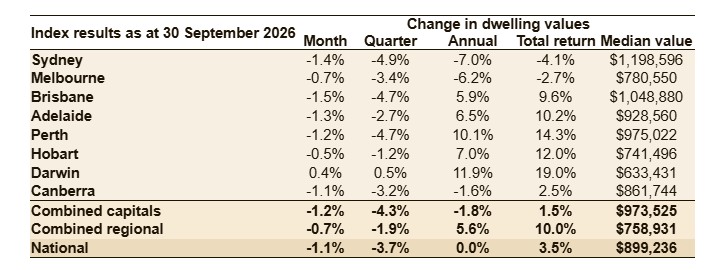
Australia's dwelling values are now 5.2% below their record highs of March, with every capital city except Darwin recording a fall.
Cotality data shows the first month of the traditionally strong spring selling season saw 97% of capital city suburbs down in value over the past three months.
Brisbane led the monthly decline among the capitals in September with values falling 1.5%, ahead of Sydney's 1.4% drop.
Cotality said the result highlights how sharply conditions have shifted in what had previously been one of the country's strongest performing housing markets.
The underperforming Melbourne market recorded a milder fall of 0.7% in September compared to the mid-sized capitals (Brisbane, Adelaide, and Perth) where values were down more than 1% for the month.
Darwin (+0.4) was the only housing market to record growth over the month.
Overall, Sydney continues to lead the housing correction with values now 8.6% below their February peak.
The decline is marginally deeper than the equivalent stage of the 2022-23 downturn, highlighting how fast demand has weakened across Australia's largest housing market.
Some markets still holding annual gains
Despite the widespread property downturn, some markets are still recording gains over the last 12 months.
Darwin (up 11.9%) and Perth (up 10.1%) hold onto the biggest annual gains while Sydney (-7.0%) and Melbourne (-6.2%) are well into negative territory.
Regional markets continue to be more resilient than the capitals with dwelling values up 5.6% annually compared to a decline of 1.8% across the combined capital cities.
Housing turnover has also plunged with estimated national home sales over the past three months tracking around 19% lower than a year ago.
Sales volumes were down most sharply in Brisbane (-27.2%), Sydney (-26.5%), and Perth (-24.2%).
Cotality research director Tim Lawless said this has implications for the broader economy with flow-on effects hitting some retail segments as well stamp duty revenue for state governments.
Supply up, demand well down
Cotality said while housing demand continues to ease, advertised supply levels have built up despite a reduced flow of listings going to market.
New listings across the combined capitals was 9.2% lower than a year ago but total stock was tracking 23.1% higher.
"Inventory levels have risen sharply because the rate of sale has fallen even faster," Mr Lawless said.
"Capital city homes are now taking a median of 39 days to sell compared to 23 days a year ago, resulting in an accumulation of advertised supply.
"The lift in available stock is improving choice for buyers but, ironically, many prospective buyers don't have the confidence or financial capacity to buy at the moment."
This will be further dented by this week's cash rate increase to 4.6%, the fourth rate hike of 2026 and Australia's highest cash rate in 15 years.
It's estimated the cumulative extra 1.00% p.a. in home loan interest rates this year has reduced the borrowing capacity of a couple on average wages by just under $100,000.
It also sees those with an $800,000 mortgage paying an extra $480 a month.
Advertising
Buying a home or looking to refinance? The table below features home loans with some of the lowest interest rates on the market for owner occupiers.
| Lender | Home Loan | Interest Rate | Comparison Rate* | Monthly Repayment | Repayment type | Rate Type | Offset | Redraw | Ongoing Fees | Upfront Fees | Max LVR | Lump Sum Repayment | Extra Repayments | Split Loan Option | Tags | Features | Link | Compare | Promoted Product | Disclosure |
|---|---|---|---|---|---|---|---|---|---|---|---|---|---|---|---|---|---|---|---|---|
5.94% p.a. | 5.98% p.a. | $2,978 | Principal & Interest | Variable | $0 | $530 | 90% |
| Promoted | Disclosure | ||||||||||
5.89% p.a. | 5.80% p.a. | $2,962 | Principal & Interest | Variable | $0 | $0 | 80% |
| Promoted | Disclosure | ||||||||||
5.99% p.a. | 5.95% p.a. | $2,995 | Principal & Interest | Fixed | $0 | $0 | 60% |
| Promoted | Disclosure | ||||||||||
5.93% p.a. | 5.93% p.a. | $2,975 | Principal & Interest | Variable | $0 | $395 | 70% | Disclosure |