

- Rent growth in Australia has outstripped wage growth by almost three times over the past five years
- The rental crisis is most acute in Western Australia where rents have grown by two-thirds over that time
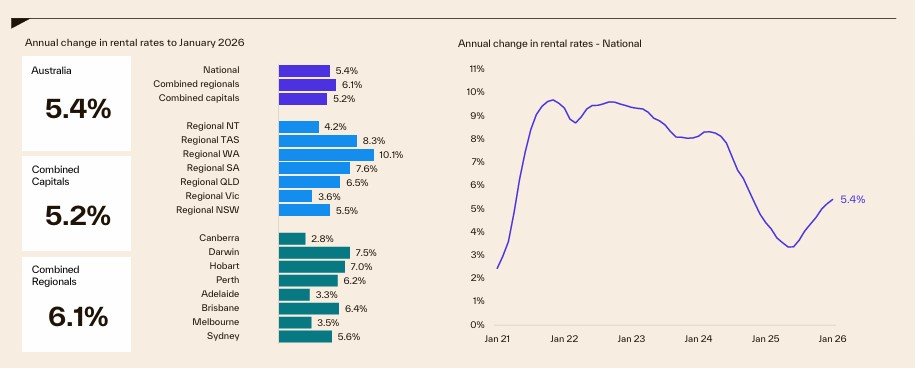
- National rental growth is reaccelerating after easing over the past couple of years
Rents in Australia have surged 44% compared with 17.5% wage growth, according to new data from property analyst Cotality.
Western Australia is at the epicentre of the rental crunch with rents soaring 66% in five years - far outstripping even the state's above-average wage growth.
The ACT is the only market where rents and wages have remained broadly aligned.
Cotality's research director Tim Lawless said the widening gap between rents and wages underlines how challenging conditions have become for tenants.
"For many households, that means a lot less flexibility in the budget and far fewer options about where and how they live," he said.
Reversal of rent fortunes
The divergence marks a sharp reversal of the previous five-year period where wages were generally growing faster than rents across most states and territories.
"Before the pandemic, renters in many parts of Australia were seeing wages grow a little ahead of rents, or at least keep pace," Mr Lawless said.
Since 2020, a combination of tight national vacancy rates, smaller household sizes, and sluggish new housing supply has reshaped the rental market.
Mr Lawless said all this moved the rental market into a "very different phase" with rent growth now far outstripping wage growth.
WA pressure builds
The Western Australian rental market has seen the steepest rent increases of any jurisdiction, with rents climbing by two-thirds in just five years.
More recently, this has been driven by rapidly escalating rents in regional WA which have grown more than 10% in just the past year.
Nationally, rental growth has regathered pace after appearing to ease over the past two years, as illustrated by the chart below:
Source: Cotality
Rents back on the surge
Over the 12 month period to September 2025, national rents rose 4.3%, outpacing the 3.5% rise in wages.
It also contributed to a further 5.4% annual increase in the cost of renting in the 12 months to January 2026.
"The fact that rental growth is reaccelerating, even after such a large cumulative increase since 2020, is a real concern," Mr Lawless said.
"It suggests demand for rental accommodation still far exceeds available supply, and that renters are facing an even larger portion of their income just to keep a roof over their heads."
Rents now account for more than a third of income
Cotality's latest housing affordability metrics for the September 2025 quarter show rental households now dedicate an average of 33.4% of their pre-tax income to rent - a record high.
That compares with a decade average of 29.2% and a recent low of 26.2% in the September quarter of 2020.
Mr Lawless said there appears to be no end in sight without a sustained lift in supply.
"With vacancy rates still around record lows in many markets and new housing completions running below what is needed to meet population growth, it's hard to see rents materially easing in the near term," he said.
"Unless wage growth accelerates meaningfully, or we see a step-change in rental supply, the risk is that affordability will deteriorate further for lower-income households in particular."
He suggested policy measures that support additional housing supply across all levels of government, industry, and investors, including:
- more build-to-rent projects
- incentives for private investment
- planning reforms that enable greater density in well-located areas
Home values continue to rise
The latest Cotality data also shows Australia's dwelling values rose another 2.4% over the quarter and 9.4% annually.
Although the monthly pace of growth has slowed, a clear two-speed market dynamic remains across capital city housing markets.
The mid-sized capitals - Brisbane, Adelaide, and Perth - are seeing monthly gains above 1% while Sydney and Melbourne are recording 0.1-0.2% monthly growth.
Median time on the market for home sales nationally is 29 days, although it is just nine days in Perth while homes are selling the slowest in Canberra at 42 days.
New listings to market continue to be well down at 17.8% lower than the same time last year.
Again, the Perth market is the tightest, with a 27% drop in inventory levels compared to a year ago.
Only Melbourne (4.5%) and Canberra (7.2%) have seen new listings track higher in the past year.
Advertisement
Buying a home or looking to refinance? The table below features home loans with some of the lowest interest rates on the market for owner occupiers.
| Lender | Home Loan | Interest Rate | Comparison Rate* | Monthly Repayment | Repayment type | Rate Type | Offset | Redraw | Ongoing Fees | Upfront Fees | Max LVR | Lump Sum Repayment | Extra Repayments | Split Loan Option | Tags | Features | Link | Compare | Promoted Product | Disclosure |
|---|---|---|---|---|---|---|---|---|---|---|---|---|---|---|---|---|---|---|---|---|
6.19% p.a. | 6.23% p.a. | $3,059 | Principal & Interest | Variable | $0 | $530 | 90% |
| Promoted | Disclosure | ||||||||||
5.89% p.a. | 5.80% p.a. | $2,962 | Principal & Interest | Variable | $0 | $0 | 80% |
| Promoted | Disclosure | ||||||||||
5.99% p.a. | 5.95% p.a. | $2,995 | Principal & Interest | Fixed | $0 | $0 | 60% |
| ||||||||||||
6.23% p.a. | 6.23% p.a. | $3,072 | Principal & Interest | Variable | $0 | $395 | 70% | Disclosure |