Apartment plague ‘the Australian property market’s biggest ever issue’

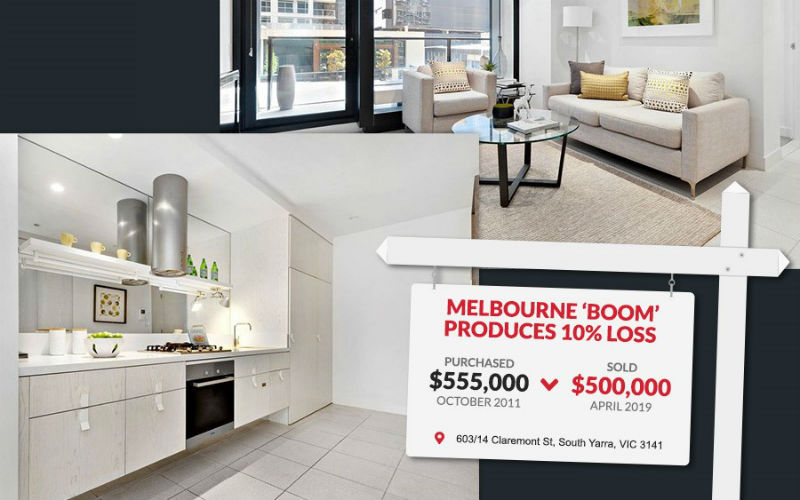
Photo source: Propertyology
Research by Propertyology delivered exclusively for Savings.com.au reveals the overall financial performance of high-rise apartments in Australia has been “horrible”, something that should concern both current and would-be property investors.
According to Propertyology’s research, Australia has produced “a tsunami” or residential apartment construction since the turn of the century.
It took Australia 250 years to build 10 million dwellings, but one million have been built in our eight biggest cities in just the last 16 years alone.
Propertyology Head of Research Simon Pressley recently referred to the over-development and subsequent shoddy workmanship of many high-rise apartment buildings as “Australian real estate’s equivalent of the Bubonic Plague“, holding grave concerns for all owners of high rise apartments built at any time during the last 20 years.
“Every year, forever and a day, there will be tens of thousands more apartments with major defects that get exposed and very few apartment owners will have any form of financial recourse,” Mr Pressley said.
“Consequently, existing apartment owners now have the enormous uncertainty of when-will-it-happen-to-me while the pool of prospective future buyers will forever diminish.

Image: supplied.
“High-rise apartment owners should be more concerned with the price growth differential between a standard house in their city and those apartments – the gap is enormous.”
“Zero growth and even substantial losses over the next decade are highly possible for apartment owners, and the precedent has already been set in hundreds of high-density suburbs.”
Simon Pressley
Mr Pressley said it’s likely this real estate bubonic plague will be the biggest issue to affect Australian property markets in its 250+ year history.
To demonstrate this, Propertyology has compared the total increase in Australia’s big-city median detached-house prices over the decade ending May 2019 with the median apartment price increase in hundreds of high-density suburbs across the country.
Find your city:
Canberra
| Median house price (May 2009) | Median house price (May 2019) | Average annual growth rate (10YE May 2019) | Cumulative capital growth rate (10YE May 2019) |
|---|---|---|---|
| $450,000 | $660,000 | 3.9% | 46% |
Simon says:
“Apartments and townhouses, as opposed to detached houses, have long been the more common dwelling type in Canberra. 62% of all new dwellings approved in Canberra over the last 16 years were apartments and townhouses.”
“Over the 10-years ending May 2019, Canberra’s median house price increased by 46%. The median apartment price increases were below 20% in 25 individual Canberra suburbs.”
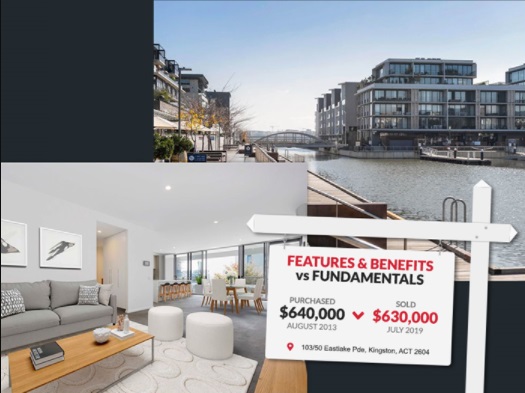
The numbers:
| Suburb | High-density suburbs (apartments/houses ratio) | Apartment capital growth rate (10YE May 2019) | Price growth differential (house v apartment) |
|---|---|---|---|
| Watson | – | -19% | 65% |
| Barton | 94% | -12% | 58% |
| Forrest | 62% | -10% | 56% |
| Hawker | – | -9% | 55% |
| Lawson | 84% | 0% | 46% |
| Wright | 62% | 0% | 46% |
| Greenway | 92% | 1% | 45% |
| Philip | 88% | 2% | 44% |
| City | 99% | 2% | 44% |
| Griffith | 64% | 32% | 12% |
10 suburbs with the highest price growth differential shown, sorted highest to lowest.
Melbourne
| Median house price (May 2009) | Median house price (May 2019) | Average annual growth rate (10YE May 2019) | Cumulative capital growth rate (10YE May 2019) |
|---|---|---|---|
| $392,000 | $750,000 | 6.7% | 91% |
Simon says:
According to Mr Pressley, the Melbourne high-rise apartment market has performed “significantly worse” than every other Australian city.
“High-density is no longer confined to Melbourne’s inner 10-kilometre ring. Suburbs like Dandenong, as far as 34 kilometres from Melbourne’s CBD, now have six apartments for every 4 houses. In Box Hill, Elwood and Parkville, apartments represent 8 out of 10 dwellings.”
“Being centrally located, in a trendy area, being close to a train station, or having a sleek fitout mean absolutely nothing from a capital growth perspective if there are thousands of same-same ‘Lego properties’ for buyers to choose from. There’s no significant point of difference from one apartment to the next.”
The numbers:
| Suburb | High-density suburbs (apartments/houses ratio) | Apartment capital growth rate (10YE May 2019) | Price growth differential (house v apartment) |
|---|---|---|---|
| Abbotsford | 70% | 3% | 88% |
| Docklands | 100% | 11% | 80% |
| Parkville | 77% | 12% | 79% |
| Balwyn | 44% | 18% | 73% |
| South Yarra | 84% | 18% | 73% |
| South Bank | 100% | 24% | 67% |
| North Melbourne | 77% | 24% | 67% |
| Melbourne City | 99% | 27% | 64% |
| Hawthorn East | 59% | 27% | 64% |
| St Kilda | 87% | 30% | 61% |
10 suburbs with the highest price growth differential shown, sorted highest to lowest.
Brisbane
| Median house price (May 2009) | Median house price (May 2019) | Average annual growth rate (10YE May 20190 | Cumulative capital growth rate (10YE May 2019) |
|---|---|---|---|
| $412,000 | $560,000 | 3.1% | 36% |
Simon says:
According to Mr Pressley, there would be very few high-rise apartments built at any stage in the last decade that would not have declined in value.
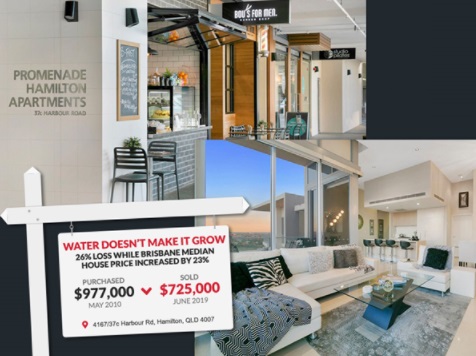
“Apartment owners hit the hardest are those within newer buildings in suburbs such as Newstead, Milton, Bowen Hills, Hamilton, Fortitude Valley, Chermside and West End.”
“10-years ago, for $420,000, one could have purchased a new apartment in Bowen Hills, 2-kilometres north of the CBD, and today it’s worth $365,000 (a 13% decline). Instead, one could have purchased a good house and backyard at Petrie for $365,000 and today it would be worth $450,000 (23% growth).”
“The lost opportunity cost from lots of same-same dwellings is big!”
The numbers:
| Suburb | High-density suburbs (apartments/houses ratio) | Apartment capital growth rate (10YE May 2019) | Price growth differential (house v apartment) |
|---|---|---|---|
| Newstead | 99% | -28% | 64% |
| Milton | 80% | -21% | 57% |
| Beenleigh | 35% | -15% | 51% |
| Woodridge | 41% | -14% | 50% |
| Bowen Hills | 96% | -13% | 49% |
| Enoggera | 31% | -13% | 49% |
| Kippa Ring | 23% | -13% | 49% |
| Waterford West | 27% | -11% | 47% |
| Carindale | 10% | -10% | 46% |
| Brisbane City | 99% | 14% | 22% |
10 suburbs with the highest price growth differential shown, sorted highest to lowest.
Sydney
| Median house price (May 2009) | Median house price (May 2019) | Average annual growth rate (10YE May 2019) | Cumulative capital growth rate (10YE May 2019) |
|---|---|---|---|
| $456,000 | $915,000 | 7.2% | 100% |
Simon says:
Sydney has amassed more than 1.8 million dwellings since the First Fleet arrived in Botany Bay in 1788, and Sydney has the highest dwelling density in Australia.
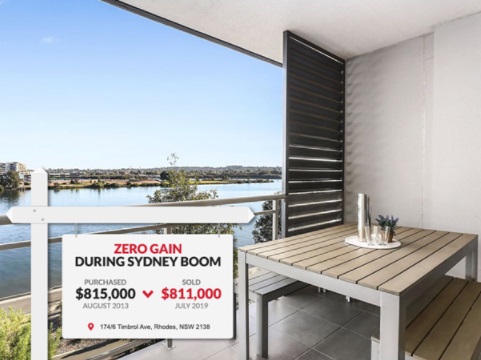
65% of the 10-year growth since May 2009 occurred during a four and a half year period ending in July 2017, but according to Mr Pressley, the growth rate for apartments was much less than that of detached houses.
“Suburbs such as Ryde, which have seen an enormous increase in apartment construction in recent years, produced only a very small portion of apartment price growth (25%, compared to 100% for Greater-Sydney houses).
“Norwest and Strathfield South (29% growth), Killara (32%), Little Bay (34%), Holroyd (40%), and Asquith (41%) were the weakest Sydney property markets.”
“There will be literally thousands of Sydney apartments which today are worth significantly less than 4 or 5 years ago.”
The numbers:
(Most suburbs in Sydney have 50% or more apartments)
| Suburb | Apartment capital growth rate (10YE May 2019) | Price growth differential (house v apartment) |
|---|---|---|
| Ryde | 25% | 75% |
| North Ryde | 25% | 75% |
| Strathfield South | 29% | 71% |
| Norwest | 29% | 71% |
| Killara | 32% | 68% |
| Little Bay | 34% | 66% |
| Holroyd | 40% | 60% |
| Asquith | 41% | 59% |
| Wentworth Point | 46% | 54% |
| Warrawee | 46% | 54% |
10 suburbs with the highest price growth differential shown, sorted highest to lowest.
Perth
| Median house price (May 2009) | Median house price (May 2019) | Average annual growth rate (10YE May 2019) | Cumulative capital growth rate (10YE May 2019) |
|---|---|---|---|
| $430,000 | $515,000 | 1.8% | 19% |
Simon says:
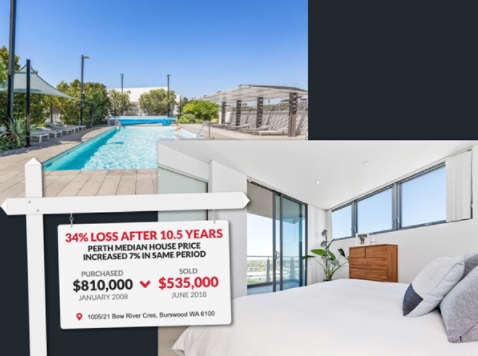
According to Mr Pressley, a number of suburbs have recorded between zero growth and a 32% decline over the last 10 years due to over-supply and over-priced high rise constructions.
“With a 21% decline in median apartment value, the cosmopolitan Perth inner-city suburb of Burswood was one of Australia’s worst-performed apartment markets over the 10-years ending May 2019.”
“Hundreds of property buyers would have initially been lured by the aesthetic of a shiny new apartment with water and city views and being located adjacent to the new Perth Stadium and the Crown entertainment precinct. Older-style apartments with character, found in locations such as Fremantle, performed quite well over the last decade.
“This is proof that apartments per se aren’t necessarily poor asset choices – substandard performance occurs as a result of cookie-cutter, same-same, mass production (and poor construction industry governance which has resulted in a significant deterioration in product quality).”
The numbers:
| Suburb | High-density suburbs (apartments/houses ratio) | Apartment capital growth rate (10YE May 2019) | Price growth differential (house v apartment) |
|---|---|---|---|
| Armadale | 16% | -32% | 51% |
| Kelmscott | 10% | -29% | 48% |
| Burswood | 77% | -21% | 40% |
| Queens Park | 17% | -20% | 39% |
| St James | 17% | -17% | 36% |
| Midland | 49% | -17% | 36% |
| Tuart Hill | 54% | -11% | 30% |
| Subiaco | 56% | -10% | 29% |
| Osborne | 70% | -11% | 30% |
| Innaloo | 29% | -9% | 28% |
10 suburbs with the highest price growth differential shown, sorted highest to lowest.
Adelaide
| Median house price (May 2009) | Median house price (May 2019) | Average annual growth rate (10YE May 2019) | Cumulative capital growth rate (10YE May 2019) |
|---|---|---|---|
| $364,000 | $480,000 | 2.8% | 31% |
Simon says:
“Adelaide’s property market has run mostly parallel to Brisbane over the last decade. Greater-Adelaide’s median house price increased by 31% during the 10-years ending May 2019,” he said.
“Aside from Adelaide’s city heart and neighbouring suburbs, the seaside suburb of Glenelg is one of the very few suburbs with apartment prominence. Villas and townhouses are found throughout suburban Adelaide.”
The numbers:
| Suburb | High-density suburbs (apartments/houses ratio) | Apartment capital growth rate (10YE May 2019) | Price growth differential (house v apartment) |
|---|---|---|---|
| Glenside | 50% | 93% | 62% |
| Salisbury | 27% | -25% | 56% |
| Goodwood | 29% | -14% | 45% |
| Walkerville | 42% | -14% | 45% |
| Ashford | 65% | 0% | 31% |
| Mawson Lakes | 37% | 2% | 29% |
| Camden Park | 40% | 4% | 27% |
| Payneham | 45% | 10% | 21% |
| Adelaide City | 83% | 12% | 19% |
| North Adelaide | 57% | 20% | 11% |
10 suburbs with the highest price growth differential shown, sorted highest to lowest.
Darwin
| Median house price (May 2009) | Median house price (May 2019) | Average annual growth rate (10YE May 2019) | Cumulative capital growth rate (10YE May 2019) |
|---|---|---|---|
| $430,000 | $490,000 | 1.3% | 14% |
Simon says:
While Adelaide’s property market follows a similar pattern to Brisbane, Darwin’s has followed Perth’s over much of the last decade.
“Over the last 16 calendar years, 51% of all new dwellings approved in Darwin were apartments,” he said.
“Whilst Darwin’s median house price produced growth of 14% over the 10-years ending May 2019, there are 10 suburbs wherein the median apartment price is lower today than 10 years ago.
“The suburb of Bayview had the highest price growth differential (Darwin houses increased by 14% while Bayview apartments declined by 19%).”
The numbers:
| Suburb | High-density suburbs (apartments/houses ratio) | Apartment capital growth rate (10YE May 2019) | Price growth differential (house v apartment) |
|---|---|---|---|
| Bayview | 57% | -19% | 33% |
| Coconut Grove | 77% | -18% | 32% |
| Woolner | 75% | -15% | 29% |
| Parap | 67% | -14% | 28% |
| Marrara | 55% | -13% | 27% |
| Leanyer | 29% | -13% | 27% |
| Fannie Bay | 61% | -12% | 26% |
| Darwin City | 95% | -5% | 19% |
| Rapid Creek | 59% | -5% | 19% |
| Milner | 48% | -2% | 16% |
10 suburbs with the highest price growth differential shown, sorted highest to lowest.
Central Coast
| Median house price (May 2009) | Median house price (May 2019) | Average annual growth rate (10YE May 2019) | Cumulative capital growth rate (10YE May 2019) |
|---|---|---|---|
| $323,000 | $635,000 | 6.8% | 96% |
Simon says:
Apartment construction in the Central Coast region is higher than a few capital cities at 41% of all new dwellings built in the past 16 years.
“Affordability pressures and congestion continue to force some Sydney residents out of the harbour city to neighbouring regional locations like the New South Wales Central Coast,” Mr Pressley said.
“A ripple effect from Sydney’s last booming property market generated a 96% increase in Central Coast’s median house price over the 10-years ending May 2019.
“While this also lifted the median apartment values across the region, the table below (once again) shows that apartment values didn’t appreciate anywhere near as much as detached houses.”
The numbers:
| Suburb | High-density suburbs (apartments/houses ratio) | Apartment capital growth rate (10YE May 2019) | Price growth differential (house v apartment) |
|---|---|---|---|
| Avoca Beach | 24% | 38% | 58% |
| Terrigal | 36% | 56% | 40% |
| Entrance North | 47% | 57% | 39% |
| West Gosford | 69% | 59% | 37% |
| East Gosford | 55% | 63% | 33% |
| Gosford City | 92% | 69% | 27% |
| Woy Woy | 31% | 78% | 18% |
| Long Jetty | 36% | 78% | 18% |
| North Gosford | 37% | 79% | 17% |
| Point Frederick | 62% | 93% | 3% |
10 suburbs with the highest price growth differential shown, sorted highest to lowest.
Newcastle
| Median house price (May 2009) | Median house price (May 2019) | Average annual growth rate (10YE May 2019) | Cumulative capital growth rate (10YE May 2019) |
|---|---|---|---|
| $325,000 | $610,000 | 6.5% | 87% |
Simon says:
Between 64% and 82% of all new dwellings approved in Newcastle in each of the last four calendar years were apartments.
“The port city’s housing density is rapidly intensifying,” he said.
“Existing Newcastle apartment owners and prospective real estate buyers would be wise to learn the valuable lessons from several capital cities and understand the downside concerns which come from high-density apartment ownership.”
The numbers:
| Suburb | High-density suburbs (apartments/houses ratio) | Apartment capital growth rate (10YE May 2019) | Price growth differential (house v apartment) |
|---|---|---|---|
| Wickham | 65% | 0% | 87% |
| Jesmond | 43% | 35% | 52% |
| Fingal Bay | 28% | 38% | 49% |
| Beresfield | – | 39% | 48% |
| Newcastle East | – | 48% | 39% |
| Wallsend | 17% | 52% | 35% |
| Hamilton | 27% | 58% | 29% |
| Cooks Hill | 48% | 62% | 25% |
| Newcastle City | 95% | 64% | 23% |
| Adamstown | 29% | 67% | 20% |
10 suburbs with the highest price growth differential shown, sorted highest to lowest.
Wollongong
| Median house price (May 2009) | Median house price (May 2019) | Average annual growth rate (10YE May 2019) | Cumulative capital growth rate (10YE May 2019) |
|---|---|---|---|
| $369,000 | $720,000 | 6.9% | 95% |
Simon says:
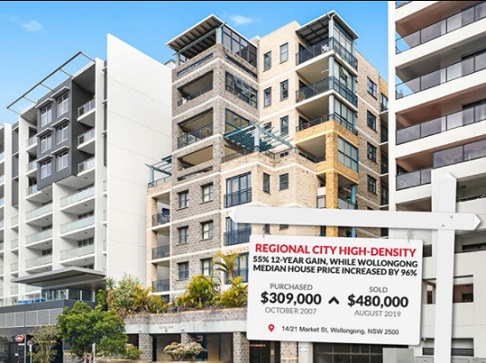
Mr Pressley said 48% of all new dwellings approved in Wollongong over the past 16 years are apartments, making it a denser city than Brisbane and Perth.
“Like its regional neighbours, Newcastle and Central Coast, Wollongong’s property market rode on the back of Sydney’s last boom and is now in a downturn. 95% price growth in median house prices over the last decade is an outstanding result.”
“Generally speaking, a modern Wollongong apartment might have increased in value by (say) 60% over the 10-years ending May 2019 while detached house prices doubled.
“Moving forward, unless there is another boom during the next decade, there must be some concern for asset value declines for Wollongong apartment within modern high-density buildings.”
The numbers:
| Suburb | High-density suburbs (apartments/houses ratio) | Apartment capital growth rate (10YE May 2019) | Price growth differential (house v apartment) |
|---|---|---|---|
| Austinmer | 24% | 15% | 80% |
| Bellambi | 35% | 79% | 16% |
10 suburbs with the highest price growth differential shown, sorted highest to lowest.