
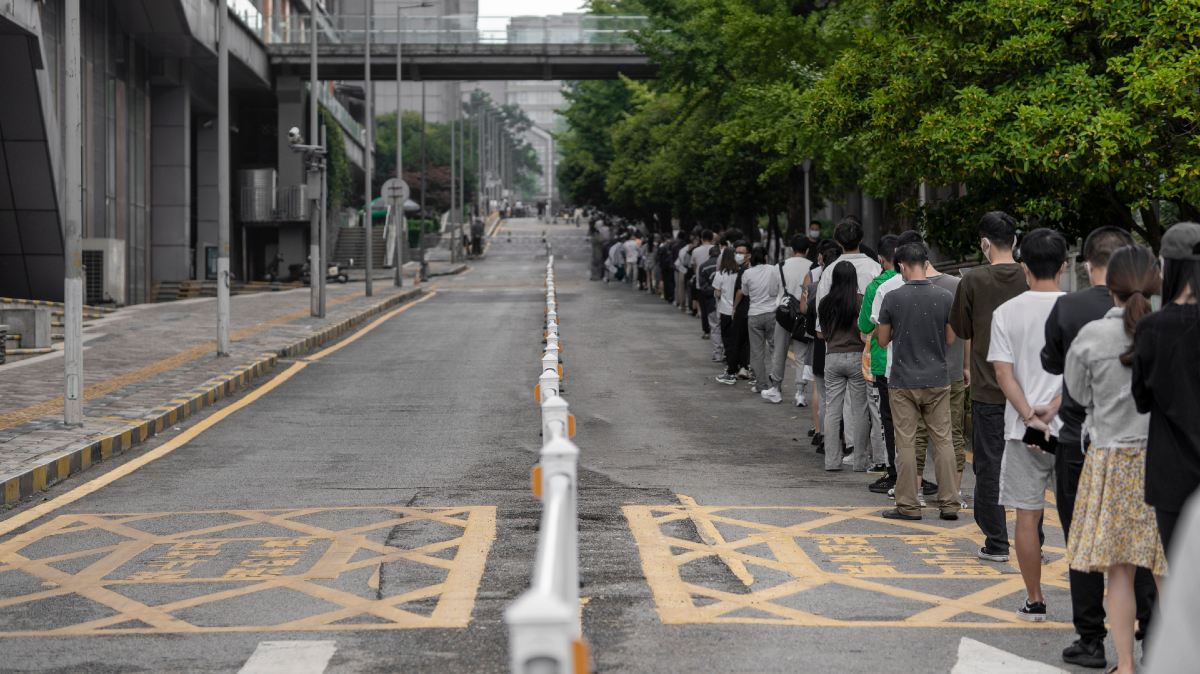
- Outflows from capital cities to regional Australia hit a new peak, with 30% more moving to the regions than the other direction
- Sydney saw the most residents leave the city, accounting for 55% of net outflows
- Queensland's Sunshine Coast continues to dominate the share of total net migration
People moving from capital cities to the regions outnumber those doing the opposite by almost 30%.
The Regional Movers Index (RMI) that tracks population movements between cities and regions hit a new high in the March 2026 quarter.
The Index was up 20% over the previous quarter and about 5% higher than a year earlier.
Sydneysiders continue to lead the exodus, accounting for 55% of capital city outflows, followed by Melburnians at 36%.
Brisbane, Perth, and Adelaide all recorded an increased share of net outflows, indicating movement from capital cities is becoming more broad-based.
Where are city residents moving to?
Toowoomba, around 130 kilometres west of Brisbane, was the favourite destination of city movers in the March quarter, seeing a staggering 236% increase over the same time last year.
But Queensland's Sunshine Coast continues to dominate share of total net migration, despite a 9% dip during the quarter.
Geelong, in regional Victoria, also remained in the top five, despite its share of new movers dropping 5.3%.
Queensland's Fraser Coast, Moorabool in Victoria (between Geelong and Ballarat), and Lake Macquarie in New South Wales rounded out the top five destinations.
Beyond established locations, the RMI shows population growth is emerging across a wider mix of regional communities with growth hot spots emerging across most states.
Other regional destinations popular with relocators include Broome in Western Australia, Townsville in North Queensland, and the Mid-Coast in NSW, covering Taree and Forster-Tuncurry.
What's behind the movement?
Regional Australia Institute (RAI) CEO Liz Ritchie said the record movement confirms the growing appeal of regional living.
"This is the highest level of capital to regional movement the RMI has ever recorded," Ms Ritchie said. "Australians are continuing to choose regional life in greater numbers, even as economic conditions shift.
"Across COVID, inflation, housing pressures and tight labour markets, the trend has been remarkably consistent - people are leaving capital cities for regions, and they’re doing so at increasing rates."
The RMI is an initiative of the Regional Australia Institute (RAI) and CommBank to better monitor population movements within Australia.
Ms Ritchie said the data collected is extremely valuable and underscores the purpose of the RMI.
"We're not just tracking movement but providing early indications of where regional growth is emerging so government, investors, industry and communities can respond before pressure builds.
"It helps identify the places that are emerging as hotspots that may need new thinking around housing and infrastructure."
Regional property boom
The data is backed up by property industry analysis that has found regional property prices have consistently outstripped capital city price growth in recent years.
The latest monthly Cotality data shows regional home values have increased by 16.7% over the past year compared to 11.3% across the combined capital cities.
Regional markets also remained more resilient amid the current property market downturn, triggered by three interest rate increases and changes to investor tax on housing announced in last month's federal budget.
Values across the combined regions rose 0.6% in May - the smallest monthly increase in a year - while capital city home values flatlined.
Pandemic trend gains stream
Regional Australia saw its first major inflows of capital city migrants in late 2020 at the height of the pandemic.
The exodus was triggered by many city dwellers seeking more space and better lifestyle during lockdowns and was fuelled, in part, by remote work arrangements.
It saw regional property prices begin to outperform capital city price growth, a trend that has continued post-pandemic as city dwellers have turned to the regions to overcome housing affordability constraints.
Advertisement
Buying a home or looking to refinance? The table below features home loans with some of the lowest interest rates on the market for owner occupiers.
| Lender | Home Loan | Interest Rate | Comparison Rate* | Monthly Repayment | Repayment type | Rate Type | Offset | Redraw | Ongoing Fees | Upfront Fees | Max LVR | Lump Sum Repayment | Extra Repayments | Split Loan Option | Tags | Features | Link | Compare | Promoted Product | Disclosure |
|---|---|---|---|---|---|---|---|---|---|---|---|---|---|---|---|---|---|---|---|---|
6.19% p.a. | 6.23% p.a. | $3,059 | Principal & Interest | Variable | $0 | $530 | 90% |
| Promoted | Disclosure | ||||||||||
5.89% p.a. | 5.80% p.a. | $2,962 | Principal & Interest | Variable | $0 | $0 | 80% |
| Promoted | Disclosure | ||||||||||
5.99% p.a. | 5.95% p.a. | $2,995 | Principal & Interest | Fixed | $0 | $0 | 60% |
| ||||||||||||
6.23% p.a. | 6.23% p.a. | $3,072 | Principal & Interest | Variable | $0 | $395 | 70% | Disclosure |