
- Rents are on the increase across Australia with Sydney houses seeing the biggest quarterly rent increases in four years
- Three new reports have found rental growth is being driven by low vacancy rates and lack of available stock nationally
- One report also attributes June quarter rent increases to landlord pricing decisions in the wake of changes to housing tax policies handed down in the federal budget
Rental growth has picked up across the nation in the June quarter, according to three independent reports on Australia's rental market, all released on Thursday.
Domain's quarterly rental report found median rents across Australia's capital cities rose $20 over the quarter, the biggest increase in almost two years.
This acceleration was backed up by Cotality's quarterly Rental Review which found national median rent hit a record $705 a week in the June quarter with the annual growth rate picking up to 5.9%.
Data used for realestate.com.au's quarterly Market Insight report also arrived at record national median rent but put the annual growth rate at 6.4%.
Rents hit record highs
All three reports found rents across capital cities and regional areas were at record highs after recording slower growth during 2025.
Sydney remains Australia's most expensive market for renters although both Melbourne and Perth recorded higher rental growth rates over the quarter, according to two reports.
Despite this, Melbourne retained its place as the cheapest capital city for renters, along with Hobart, according to realestate.com.au.
Over the longer term, Cotality reported national rents have shot up 40.6% over the past five years - an average of an extra $204 a week.
Over the previous five-year period (June 2016 - June 2021), median rents rose by just $55 a week, or 12.2%.
The jump sees households now having to allocate around one-third of their gross income to rent compared to around 27% five years ago.
House rents outstrip unit rental growth
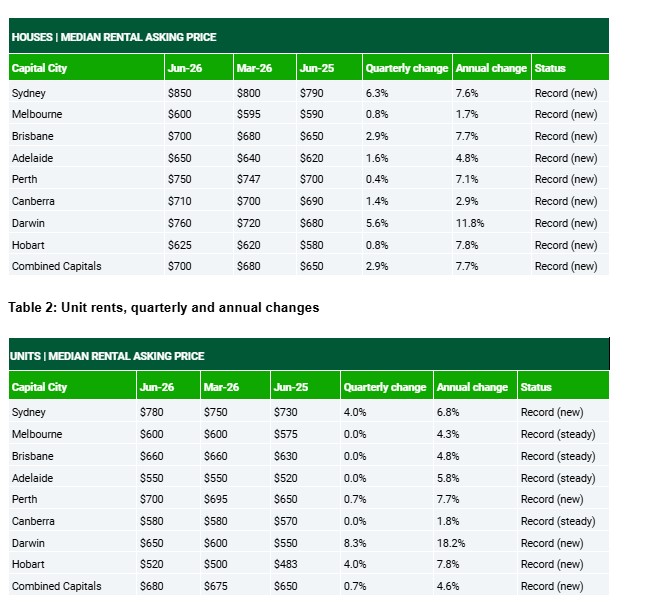
According to Domain, Sydney house rents saw the largest quarterly increase in four years with median rent up $50 (6.3%) to a record $850 a week while Brisbane house rents hit a record $700 a week.
But it was Darwin that recorded the strongest annual rental growth (11.8%), overtaking Perth as Australia's second most expensive rental market.
All three reports noted Darwin's tight rental market with low vacancy rates and listings more than 26% below the city's long-term average, according to Cotality.
In the house-unit divide, Domain found houses led the surge in national rental growth while unit markets were more subdued, picking up only in Sydney and Darwin.
Darwin has seen unit rents surge 18.2% in the past year with a record-low vacancy rate of just 0.1%.
Domain's national median rental asking prices for houses and units in the June quarter appears below:
Source: Domain June Quarter 2026 Rent Report
'Two-speed' rental market
The Domain report suggests the data points to city-specific pricing rather than a house-versus-units narrative nationally.
Overall, despite near historic lows in rental vacancy rates, Melbourne, Adelaide, Perth and Hobart have likely seen rental growth ease because of affordability constraints.
Meantime, Sydney, Darwin, Brisbane, and Canberra are showing the opposite - growth accelerating despite already tight conditions, suggesting landlords still have room to push rents further.
However, Cotality noted rental markets are approaching a threshold where affordability will constrain further growth, particularly in regional areas where lower incomes are already seeing households spend more than 35% of their income on rent.
Why are rents rising when the property market is slowing?
Domain chief residential economist Nicola Powell said the quarterly rental increase was too sudden and concentrated to be explained by seasonal factors alone.
"As more clarity emerged around proposed housing investment policy changes during April and May, many landlords appear to have responded by increasing asking rents where market conditions gave them the opportunity," Dr Powell said.
The report found rather than gradually feeding through over time, rental increases were being brought forward, suggesting owners are positioning for tighter supply conditions.
It's worth noting rental increases are also subject to state and territory government restrictions although these generally regulate timing (typically once a year) and not the size of rental increases.
Only the ACT caps rental increases to no more than 10% above current inflation.
"At this stage, we're seeing the impact more in landlord sentiment than in rental availability," Dr Powell said.
"However, over time, we expect policy changes to have a greater influence on investor behaviour, which could ultimately affect rental supply."
How will investor housing tax changes affect the rental market?
Domain's analysis suggests changes to negative gearing and capital gains tax, announced in the May federal budget, are already having an effect on Australia's rental market.
See also: What will changes to negative gearing mean?
Under the new rules, existing properties purchased after 7:30 pm 12 May 2026, budget night, will not be permitted to claim negative gearing tax benefits from 1 July 2027.
Homes purchased before that time can continue to be negatively geared until they are sold while full negative gearing benefits will still apply to new build homes.
As well, from 1 July 2027, the 50% discount on capital gains from investments held for more than 12 months will be scrapped and replaced with an inflation-indexed model of calculating gains with a new minimum tax rate of 30%.
Property analysts say the changes are seeing investors turn away from the property market, contributing to the marked downturn in home prices and auction clearance rates in Sydney and Melbourne and the slowdown in other markets.
See also:
- Australia's housing market passes peak as home values fall 0.4% in June
- Australia's housing boom hits a wall as prices drop and profits peak
- RBA hits pause but housing slowdown still gaining speed
With investors less active in the market, it should see more homes being purchased by owner occupiers, including first home buyers, the government's stated aim in introducing the new investor tax regime.
But property figures point out that without an increase in housing supply, this will lead to ongoing shrinkage in the national pool of homes for rent, ultimately fuelling higher rents.
As well, those who choose to invest in property after 12 May will be increasingly looking to positively geared properties, that is, where rental income covers the cost of owning the property, also putting upward pressure on rents.
What happened the last time negative gearing was scrapped?
Australia previously wound back negative gearing between 1985-87 under Hawke-Keating government tax reforms.
The rule changes were similar to the current model, allowing rental losses to be claimed only against other or future property income and not offset against income from other sources, including wages.
In the two years negative gearing was abolished, some Australian rental markets, particularly Sydney and Perth, saw marked rental property shortages and rapidly escalating rents.
The effects weren't as pronounced in other cities, suggesting variations between markets, but the government reinstalled negative gearing in September 1987.
Some analysts suggest the same scenario will play out in the current market as former rental properties are put up for sale and purchased by owner occupiers, triggering increased competition for available rental properties and, in turn, driving up rents.
All three reports agree the current lack of rental stock across the country is a primary driver of escalating rents, arguably not the ideal starting point for new investor tax policies on residential housing.
Dr Powell, however, is circumspect.
"The real test will come in the months and years ahead as investors adjust to the new policy environment and those decisions begin to flow through to housing availability and rental conditions," she said.
Advertisement
Buying a home or looking to refinance? The table below features home loans with some of the lowest interest rates on the market for owner occupiers.
| Lender | Home Loan | Interest Rate | Comparison Rate* | Monthly Repayment | Repayment type | Rate Type | Offset | Redraw | Ongoing Fees | Upfront Fees | Max LVR | Lump Sum Repayment | Extra Repayments | Split Loan Option | Tags | Features | Link | Compare | Promoted Product | Disclosure |
|---|---|---|---|---|---|---|---|---|---|---|---|---|---|---|---|---|---|---|---|---|
6.19% p.a. | 6.23% p.a. | $3,059 | Principal & Interest | Variable | $0 | $530 | 90% |
| Promoted | Disclosure | ||||||||||
5.89% p.a. | 5.80% p.a. | $2,962 | Principal & Interest | Variable | $0 | $0 | 80% |
| Promoted | Disclosure | ||||||||||
5.99% p.a. | 5.95% p.a. | $2,995 | Principal & Interest | Fixed | $0 | $0 | 60% |
| ||||||||||||
6.23% p.a. | 6.23% p.a. | $3,072 | Principal & Interest | Variable | $0 | $395 | 70% | Disclosure |