Analysing data from CoreLogic, Propertyology tracked the quarterly median house price changes in all 550 local government areas in Australia.
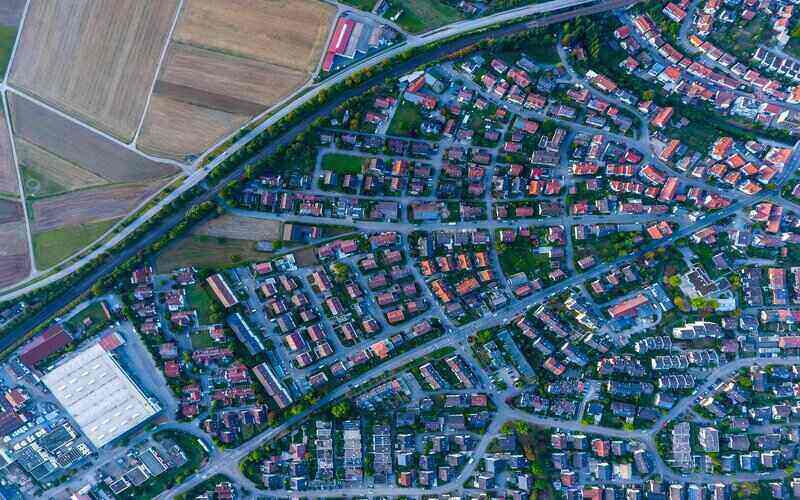
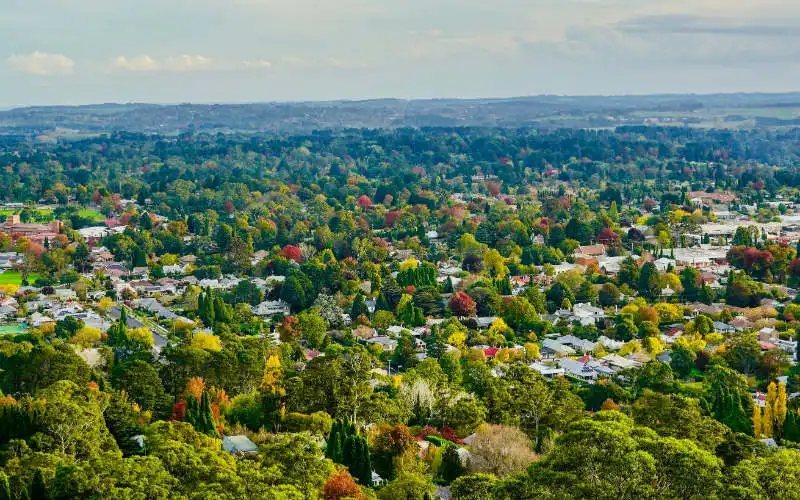
Over the three months to February 2019, Propertyology’s report found almost all of the top performing property areas were in regional locations many people wouldn’t have thought to look.
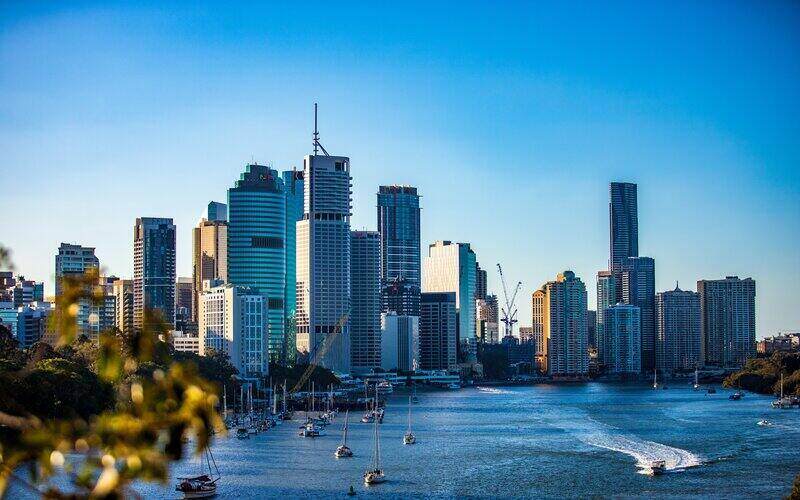
Alternatively, some of the most poorly performing areas lay in and around the major cities.
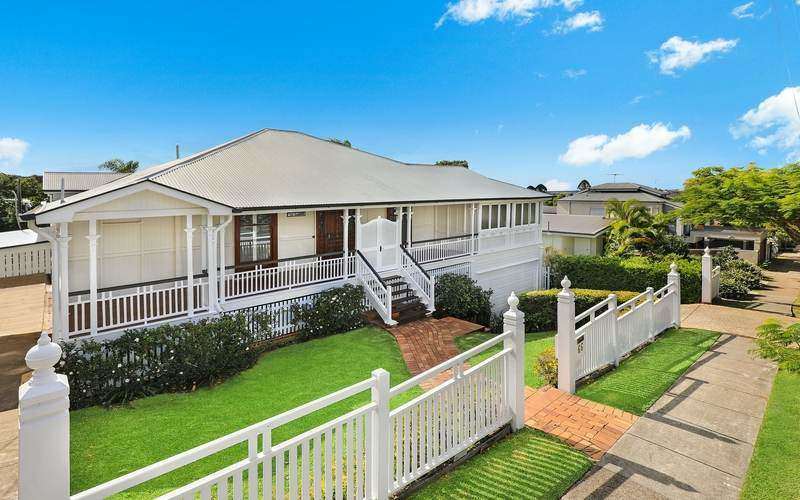
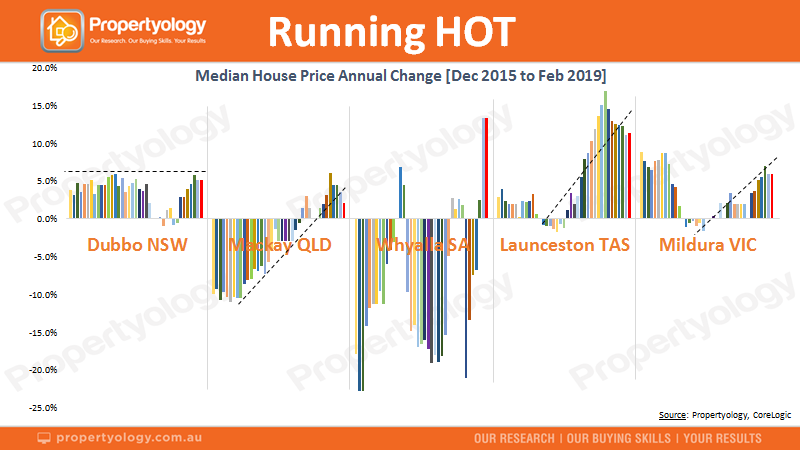
The best performing property hotspot was Whyalla, South Australia’s third largest city.
At the start of 2019, Whyalla had recorded a decline of 7.4%, but the latest quarterly data shows a 13.3% increase in median house prices.
According to Propertyology, the factors that led to its sudden increase are an attractive median house price of $200,000 and a number of infrastructure projects, such as a new $600 million mega steel plant and a $45 million hotel.
Other ‘red hot’ markets according to Propertyology include Dubbo, Mackay, Launceston and Mildura.
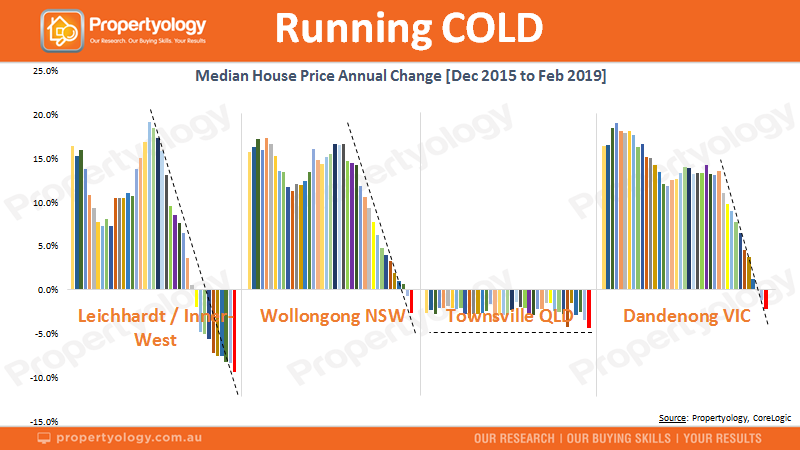
Meanwhile, some of the worst performing areas over the February quarter were located in the Melbourne area, where prices declined by between 3.6% to 7.5%.
Blue-chip Sydney areas like Balmain and Parramatta have seen median house prices decline by more than $225,000 over the last 18 months.
Woolongong, Australia’s sixth-most expensive city has returned a fairly dismal -2.6% over the February quarter.
Hottest and coldest markets
The following tables, courtesy of Propertyology and CoreLogic, show the biggest median house price gains and falls over the February 2019 quarter.
South Australia
| Hot | Not hot |
|---|---|
| Whyalla (13.3%) | Port Lincoln (-5.2%) |
| Clare & Gilbert Valley (6.3%) | Berri (-4.3%) |
| Loxton Waikerie (5.7%) | Murray Bridge (-2.1%) |
| Prospect (4.3%) | Norwood Payenham (-1.4%) |
| Holdfast Bay (3.8%) | Campbelltown (-1.0%) |
Victoria
| Hot | Not hot |
|---|---|
| Alpine (4.2%) | Melbourne City (-7.5%) |
| Moorabool (3.8%) | Port Phillip (-4.5%) |
| Golden Plains (3.7%) | Monash (-4.1%) |
| Corangamite (3.6%) | Bayside (-4.1%) |
| Melton (0.4%) | Boroondara (-3.6%) |
New South Wales
| Hot | Not hot |
|---|---|
| Gundagai (7.0%) | Lane Cove (-6.7%) |
| Lithgow (4.3%) | Rockdale (-4.0%) |
| Bellingen (2.9%) | Kiama (-3.2%) |
| Mosman (2.1%) | Wollongong (-2.6%) |
| Parkes (1.4%) | Inner-West Sydney (-2.3%) |
Queensland
| Hot | Not hot |
| Charters Towers (7.5%) | Roma (-7.9%) |
| Biloela (4.4%) | Burdekin (-5.9%) |
| Mossman (2.4%) | Ingham (-4.8%) |
| Noosa (1.9%) | Rockhampton (-1.9%) |
| Moreton Bay (0.9%) | Townsville (-1.5%) |
Western Australia
| Hot | Not hot |
|---|---|
| Port Hedland (3.7%) | Nedlands (-3.1%) |
| Esperance (3.0%) | Augusta-Margaret River (-3.0%) |
| Karratha (2.6%) | Bayswater (-1.9%) |
| Subiaco (2.3%) | Canning (-1.9%) |
| Fremantle (2.1%) | Victoria Park (-1.7%) |
Tasmania
| Hot | Not hot |
|---|---|
| Derwent Valley (3.5%) | Waratah-Wynyard (-1.9%) |
| Northern Midlands (3.3%) | |
| Sorrell (3.0%) | |
| Glenorchy (1.9%) | |
| Burnie (1.8%) |
Northern Territory and Australian Capital Territory
| Hot | Not hot |
|---|---|
| Palmerston (3.7%) | Darwin City (-1.1%) |
| Canberra (0.8%0 | Litchfield (-0.8%) |
How to identify potential property hotspots
Propertyology’s Head of Research Simon Pressley said there are more than twenty factors that influence housing demand and buyer sentiment in individual property areas.
“Many of these factors are associated with local economic conditions, job creation, local projects, and the local volume of housing supply,” Mr Pressley told Savings.com.au.
“Collectively, it’s the sum of all these factors which determines the performance of property markets in each town and city.
“As we’ve consistently said for a few years now, the economic conditions in many non-capital city locations are much better than what capital city folk realise.”
Whyalla, with its low housing prices and surge in infrastructure, would be a good example of this.
When it comes to danger signs property investors need to be aware of when looking, Mr Pressley said too many people confuse population size with safety.
“The median house price in Australia’s two largest cities has declined by $130,000 and $80,000 respectively over the last year and a bit,” he said.
“When investing in locations outside of capital cities, it’s important that the location has economic diversity as opposed to being a one-industry location.
“There are approximately 40 individual cities and towns which Propertyology describes as mini capitals – they have quality infrastructure, expanding economies, growing populations, great lifestyles, and affordable housing.”
Think of property like shares
Mr Pressley believes it’s important for people to look beyond their own home city when investing in property, and that property-hopefuls should adopt the mindset of an astute share investor when it comes to choosing.
“Those who favour property as an asset class to support their future financial independence need to focus less on the bricks-and-mortar and start thinking about shelter as a commodity,” he said.
“The equivalent of the ‘stock exchange’ for property investors is the property markets of the 550 individual city councils across Australia’s 8 states and territories.
“Whether you personally would like to live in a particular location is no more relevant than whether a share investor chooses to bank with CBA.”

Ready, Set, Buy!
Learn everything you need to know about buying property – from choosing the right property and home loan, to the purchasing process, tips to save money and more!
With bonus Q&A sheet and Crossword!

 Harry O'Sullivan
 Emma Duffy