

New data shows 97% of Australian home owners made a profit selling their houses in the six months to June 2025, as did 88% of unit owners.
A Domain property analysis found houses recorded the highest proportion of profit-making resales since 2005 while for units, it was the highest rate in three years.
In dollar terms, the gross median gain for a house sale nationally rose to $365,000 while unit profits came in at a median of $202,000.
For the minority selling at a loss, the shortfalls held roughly steady at $55,000 for houses and $46,000 for units.
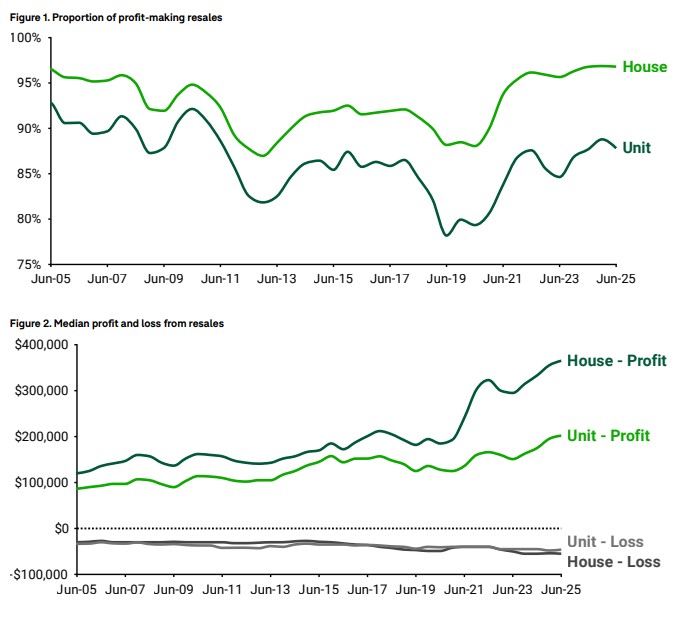
Source: Domain Profit and Loss Report, 1H 2025
Homeowners holding on for longer
Domain analysts attribute the returns to longer holding periods as will as the impact of rising property prices post-pandemic.
Sellers are now holding their houses for around nine years and units for eight years - both up from an average of six years in 2010.
The longer hold-times allow more time for equity growth and provide a buffer against short-term market fluctuations.
Domain analysis shows most homeowners are also selling from a position of financial strength, with little evidence of forced or loss-making sales.
Yet some housing markets are performing better than others.
Brisbane, Perth - safe as houses?
More than 99% of house resales in Brisbane and Perth delivered gains with Sydney and Adelaide not far behind.
The boom markets of Perth and Adelaide delivered the greatest median gains year-on-year, up 22.4% for Perth and 19.6% for Adelaide.
But in dollar terms, Sydney ($700,500) and Brisbane ($480,000) delivered house sellers the biggest financial windfalls.
At the other end of the scale, Darwin delivered the lowest rate of profit-making house sales at 84.2%.
Melbourne (94.8%) fared a little better than Canberra (92.9%) and Hobart (91.6%).
Regional sales broadly mirrored the national figures in house resales but outperformed in terms of units.
Units paint a different picture
Outcomes of unit sales varied widely across the capital city and regional markets.
Brisbane (99%), Perth (97.8%), and Adelaide (97.3%) outperformed in terms of profitable resales.
The combined regional unit market (95.7%), with its lower concentration of unit dwellings, also outperformed many of the capital cities.
Melbourne (73%) fell well below other Australian capitals, except for Darwin where only 53.4% of unit sales returned a profit.
In dollar terms, Brisbane and Adelaide delivered the highest median resale profits for units, even outpacing Sydney.
Rental growth back on the rise
The latest data underscores the benefits of home ownership, with new figures from Cotality showing rental growth across the capital cities has picked up for the first time in two years.
Cotality's capital city rental value index rose 3% in the year to July, up from 2.7% in June, marking the end of a 16-month run of slowing or stable rental growth.
Cotality's economist Kaytlin Ezzy said the trend bears watching, given the weighting rents have in measuring inflation.
"The housing component makes up more than one-fifth of the CPI [consumer price index] basket, with rents alone accounting for 6.6%," she said.
The latest quarterly CPI data showed rents rose 4.5% over the year to June, down from the 7.8% rise seen over the year to March 2024.
Adding to concern over emerging housing inflation is an uptick in construction costs, with the Cordell index rising to 2.9% over the year to June, up from 2.6% over the previous 12 months.
Brisbane, Sydney lead rental growth
Brisbane saw 12-month rental growth of 4.6% to July, up from 3.2% as at February.
Meantime, Sydney recorded an uptick to 2.4% over the 12 months to July, from a recent low of 1.8% in the year to May.
Ms Ezzy said both cities' unit markets have driven the uptick with vacancy rates holding near historic lows across their unit sectors.
By contrast, Melbourne is yet to see an rise in the pace of rental growth with annual increases holding steady at 1.1% over the year to July.
Advertisement
Buying a home or looking to refinance? The table below features home loans with some of the lowest interest rates on the market for owner occupiers.
| Lender | Home Loan | Interest Rate | Comparison Rate* | Monthly Repayment | Repayment type | Rate Type | Offset | Redraw | Ongoing Fees | Upfront Fees | Max LVR | Lump Sum Repayment | Extra Repayments | Split Loan Option | Tags | Features | Link | Compare | Promoted Product | Disclosure |
|---|---|---|---|---|---|---|---|---|---|---|---|---|---|---|---|---|---|---|---|---|
6.19% p.a. | 6.23% p.a. | $3,059 | Principal & Interest | Variable | $0 | $530 | 90% |
| Promoted | Disclosure | ||||||||||
5.89% p.a. | 5.80% p.a. | $2,962 | Principal & Interest | Variable | $0 | $0 | 80% |
| Promoted | Disclosure | ||||||||||
6.38% p.a. | 6.66% p.a. | $3,121 | Principal & Interest | Variable | $299 | $0 | 85% | |||||||||||||
6.23% p.a. | 6.23% p.a. | $3,072 | Principal & Interest | Variable | $0 | $395 | 70% | Disclosure |