
Sydney, Melbourne and the ACT are all starting to come out of lockdown just in time for spring selling season.
As a result, the number of new listings are starting to climb, but overall stock levels still remain historically low.
New listings surged 28.2% nationally over the past four weeks, equal to more than 45,000 new properties added to the market according to CoreLogic.
Of these properties, 71.1% were houses - down from the typical five-year average of 74%.
The remaining new stock was made up of unit listings, which have increased 39% in the past four weeks. This is compared to a 24% rise in houses for sale.
The figure below showcases house and unit stock today compared to the five-year average before the pandemic over a four week period.
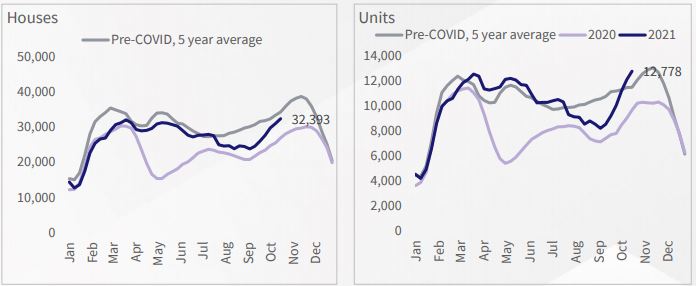
Source: CoreLogic
Overall stock in capital cities remains low
Despite the recent increase in listings, the market still remains tight in most capital cities.
This is because there is limited overall stock available, which refers to all listings and not just newly added listings.
The majority of new stock available is spread across Sydney and Melbourne, where listings rose by 2,186 and 6,142 respectively.
Across the regions that have seen the biggest upticks in new properties, there has been a mix of both 'desirable' owner-occupier markets and investor markets.
There were also some small rises in the ACT (301) and Hobart (15).
However, when compared to pre-pandemic listing levels, almost everywhere (excluding Melbourne) is experiencing an overall shortage in available properties for sale.
This shortage is most evident in Queensland. Available listings are 9,874 below the five-year average in Greater Brisbane; the rest of Queensland is down by 18,459.
What does this mean for buyers?
New listings are 'likely' going to continue rising in the coming weeks before a seasonal decline towards the end of November according to CoreLogic's Head of Research Eliza Owen.
However, new properties for sale are 'less desirable' for owner occupiers, as the biggest increases have been in units and across investor-saturated markets in Sydney and Melbourne.
Potential good news is that buyers could have more 'bargaining power' given the influx of properties available.
"While there are signs vendors are responding to the high price growth in some of the popular or coastal markets, which could create more bargaining power for some buyers, listings volumes are in many cases still well below historic averages," Ms Owen said.
"With investor activity also stepping up through 2021, the lift in advertised supply across areas more aligned with rental housing is arguably well timed."
Advertisement
Buying a home or looking to refinance? The table below features home loans with some of the lowest interest rates on the market for owner occupiers.
| Lender | Home Loan | Interest Rate | Comparison Rate* | Monthly Repayment | Repayment type | Rate Type | Offset | Redraw | Ongoing Fees | Upfront Fees | Max LVR | Lump Sum Repayment | Extra Repayments | Split Loan Option | Tags | Features | Link | Compare | Promoted Product | Disclosure |
|---|---|---|---|---|---|---|---|---|---|---|---|---|---|---|---|---|---|---|---|---|
5.54% p.a. | 5.58% p.a. | $2,852 | Principal & Interest | Variable | $0 | $530 | 90% |
| Promoted | Disclosure | ||||||||||
5.49% p.a. | 5.40% p.a. | $2,836 | Principal & Interest | Variable | $0 | $0 | 80% |
| Promoted | Disclosure | ||||||||||
5.64% p.a. | 5.89% p.a. | $2,883 | Principal & Interest | Variable | $250 | $250 | 60% |
| Promoted | Disclosure | ||||||||||
5.64% p.a. | 5.89% p.a. | $2,883 | Principal & Interest | Variable | $248 | $350 | 60% |
|


Image by Linda Xu on Unsplash

Ready, Set, Buy!
Learn everything you need to know about buying property – from choosing the right property and home loan, to the purchasing process, tips to save money and more!
With bonus Q&A sheet and Crossword!


 Bernadette Lunas
 Denise Raward
 Harry O'Sullivan
 Jacob Cocciolone
 Datamentary