The Real Estate Institute of Australia (REIA) Housing Affordability Report released yesterday shows both rental and housing affordability improved over the past year and particularly in the June quarter.
According to the report and REIA president Adrian Kelly, the proportion of income required to meet rent payments decreased by 0.4 percentage points to 23.3% over the quarter, and is down by 0.5 percentage points compared to this time last year.
For reference, the threshold for rental stress is generally considered to be 30% of one's income.
“This can be mainly attributed to the reduction or stabilisation of rents during the June quarter with only the Australian Capital Territory having an increase in rents," Mr Kelly said.
Looking to compare low-rate, variable home loans? Below are a handful of low-rate loans in the market.
| Lender | Home Loan | Interest Rate | Comparison Rate* | Monthly Repayment | Repayment type | Rate Type | Offset | Redraw | Ongoing Fees | Upfront Fees | Max LVR | Lump Sum Repayment | Extra Repayments | Split Loan Option | Tags | Features | Link | Compare | Promoted Product | Disclosure |
|---|---|---|---|---|---|---|---|---|---|---|---|---|---|---|---|---|---|---|---|---|
5.54% p.a. | 5.58% p.a. | $2,852 | Principal & Interest | Variable | $0 | $530 | 90% |
| Promoted | Disclosure | ||||||||||
5.49% p.a. | 5.40% p.a. | $2,836 | Principal & Interest | Variable | $0 | $0 | 80% |
| Promoted | Disclosure | ||||||||||
5.64% p.a. | 5.89% p.a. | $2,883 | Principal & Interest | Variable | $250 | $250 | 60% |
| Promoted | Disclosure | ||||||||||
5.64% p.a. | 5.89% p.a. | $2,883 | Principal & Interest | Variable | $248 | $350 | 60% |
|


Indeed, the Domain Rental Report for the June quarter (April, May and June) showed a 3.2% fall in the national unit rental price worth $15 per week - the biggest decline in over 15 years.
It also found that house rent prices fared a bit better than units in the June quarter but still fell by 1.2% nationally to $446 per week.
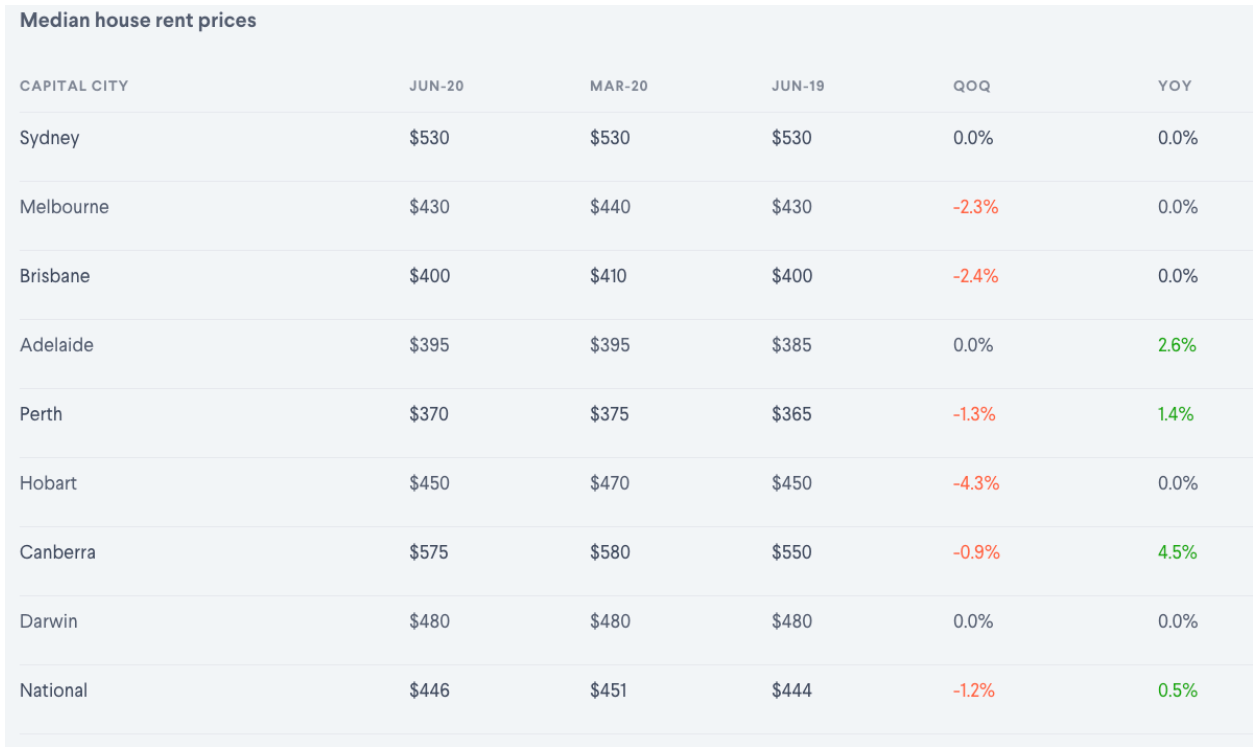
Source: Domain
The news that rental affordability is at its highest since 2007 will be news to some, particularly those on JobSeeker, JobKeeper or the pension.
Another newly released rental affordability report by Anglicare on Monday found that even on the current increased rate of JobSeeker as well as JobKeeper, just 1% of rental properties across Australia on average are deemed affordable.
Cutting the JobSeeker rate by $150 in September would make just 0.2% of rental properties (168) affordable, and cutting back to the old rate in December would make just 13 properties (0%) affordable.
“For people on the lowest incomes, rentals are even less affordable than they were back in March,” Anglicare Australia Executive Director Kasy Chambers said.
“Most of the price drops are at the higher end of the market. At the same time, more and more people are competing for cheap housing.
"That’s squeezing people out of the market. With 1.6 million people locked out of work, the new rate of JobSeeker is the only thing keeping them afloat."
So while rental affordability might be better overall, those at the lower end may be competing for a smaller share of affordable rental properties in today's rental market.
Which states have the best rental affordability?
According to REIA's report, Western Australia has the best rental affordability, with the proportion of family income required to meet the median rent decreasing to 16.1%, a decrease of 0.5 percentage points over the quarter.
The second-most affordable belongs to The Australian Capital Territory, boasting a rent-income ratio of 19.2%, although this has actually increased by 0.2 percentage points over the quarter.
The state with the worst rental affordability is not New South Wales as you might expect, but Tasmania.
Rental affordability in Tasmania improved over the quarter, with the proportion of income required to meet median rents decreasing by 2 percentage points to 28.5%.
New South Wales did have the second-worst rental affordability rating, requiring 27.5% of income going towards rent for the median household (a 0.5% decrease over the quarter).
Each state's rental affordability can be seen in the table below.
|
State |
Income-rent ratio |
Median house rent - June quarter |
Median unit rent - June quarter |
|
WA |
16.1% |
$370 |
$320 |
|
ACT |
19.2% |
$575 |
$470 |
|
NT |
20.2% |
$480 |
$380 |
|
QLD |
21.5% |
$400 |
$380 |
|
SA |
21.5% |
$395 |
$320 |
|
VIC |
22.5% |
$430 |
$415 |
|
NSW |
27.5% |
$530 |
$500 |
|
TAS |
28.5% |
$450 |
$380 |
|
AUS AVERAGE |
22.12% |
$453.75 |
$395.62 |
Sources: Income-rent ratio from REIA, rent cost data via Domain. House and unit rent data for each state’s respective capital city.

Ready, Set, Buy!
Learn everything you need to know about buying property – from choosing the right property and home loan, to the purchasing process, tips to save money and more!
With bonus Q&A sheet and Crossword!


 Bernadette Lunas
 Denise Raward
 Harry O'Sullivan

 Brooke Cooper