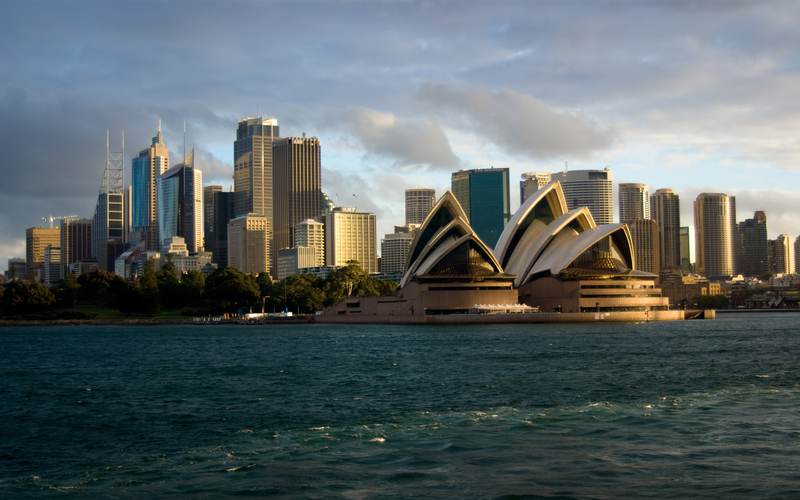
Sydney property values led the charge, increasing 1.4% across the month to April 2023.
CoreLogic Research Director Tim Lawless detailed the 0.6% uptick nationally to April is courtesy of a combination of low advertised stock levels, extremely tight rental conditions and additional demand from overseas migration.
“Although interest rates are high and there is an expectation the economy will slow through the year, it’s clear other factors are now placing upward pressure on home prices,” Mr Lawless said.
“With rental markets this tight, it’s likely we are seeing some spillover from renting into purchasing, although, with mortgage rates so high, not everyone who wants to buy will be able to qualify for a loan.
“Similarly with net overseas migration at record levels and rising, there is a chance more permanent or long-term migrants who can afford to, will skip the rental phase and fast track a home purchase simply because they can’t find rental accommodation.”
Despite the national increase, across the capitals CoreLogic’s Index revealed Hobart recorded the largest decline with property values, falling -0.9% in the month to April.
Further, the decline in property values throughout much of 2022 and the first quarter of 2023 has seen Melbourne property prices return the closest to pre-COVID levels, sporting a buffer of only 0.6%.
To put this into perspective, at their peak to February 2022 Melbourne property values lifted 17.3%.
This lies in stark contrast to Regional SA where property values have lifted nearly 50% above March 2020 levels to April 2023, with the region still within its peak growth phase.
|
Index results as at 31 March, 2023 |
Change in dwelling values |
||||
|
Month |
Quarter |
Annual |
Total return |
Median value |
|
|
Sydney |
1.4% |
0.4% |
-12.1% |
-9.6% |
$1,014,393 |
|
Melbourne |
0.6% |
-0.9% |
-9.0% |
-6.0% |
$747,322 |
|
Brisbane |
0.1% |
-1.7% |
-8.6% |
-4.5% |
$698,071 |
|
Adelaide |
-0.1% |
-1.1% |
3.0% |
6.5% |
$645,721 |
|
Perth |
0.5% |
0.1% |
1.9% |
6.5% |
$567,111 |
|
Hobart |
-0.9% |
-4.0% |
-12.9% |
-9.4% |
$650,689 |
|
Darwin |
-0.4% |
-0.9% |
1.6% |
7.6% |
$492,465 |
|
Canberra |
-0.5% |
-2.0% |
-8.1% |
-4.6% |
$828,175 |
|
Combined capitals |
0.8% |
-0.4% |
-8.7% |
-5.5% |
$764,995 |
|
Combined regionals |
0.2% |
-1.0% |
-5.7% |
-1.7% |
$578,486 |
|
National |
0.6% |
-0.6% |
-8.0% |
-4.7% |
$704,723 |
Source: CoreLogic Home Value Index April 2023
Westpac economist Matthew Hassan said this might be short-lived, however.
"Whether even this can be sustained is also questionable given the interest rate and wider economic headwinds bearing down on the housing sector," Mr Hassan said.
"‘Stop-start’ periods alternating between stability and price slippage are fairly rare for housing but not unheard of, particularly when rates remain high and the economy is moving through a substantial downturn."
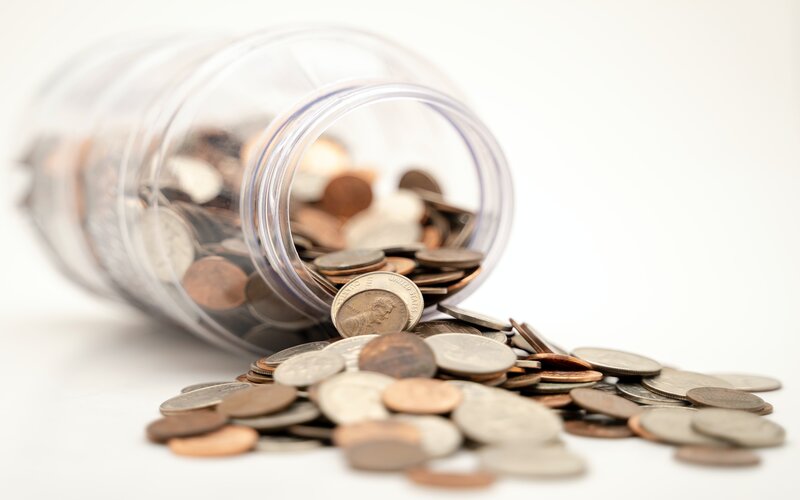
Declining property values coupled with some of the highest saving account rates in a decade have prompted young Aussies to take notice, with YouGov data commissioned by ubank revealing 69% are looking to purchase a property within the next five years, with 47% confident they can succeed.
ubank Chief Product Officer Kanishka Raja noted while current economic conditions can seem daunting, cost-of-living pressures have forced young Australians to pay close attention to their finances and reign in budgets where possible.
“We’re seeing greater care and consideration when it comes to spending, while those with big financial goals like homeownership remain determined,” Mr Raja said.
“People are doubling down on savings, with young Australians estimating they have an average $37,921.20 worth of personal savings.
“Unsurprisingly, those who intend to buy a property in the next five years have more personal savings than those who don’t - $44,606 compared to $19,393.”
Hurdles remain for first home buyers
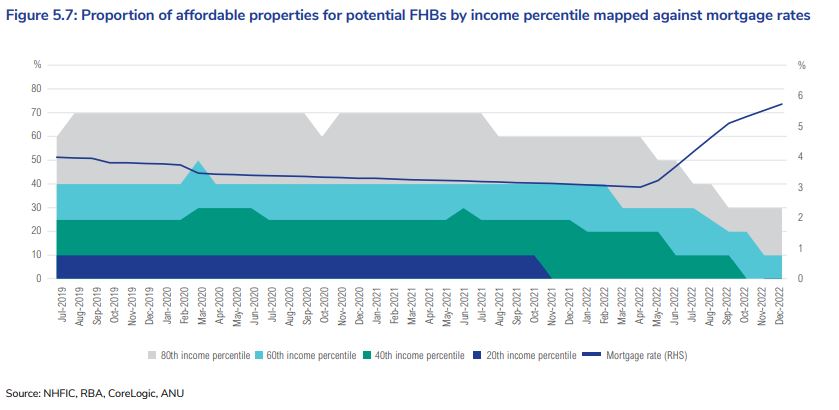
Despite the strong appetite to grab one-foot on the property ladder, the National Housing Finance and Investment Corporation’s State of the Nation’s report for 2022-23 revealed mortgage serviceability for potential first home buyers has eroded following 10 consecutive interest rate rises.
The report notes until 2021, 70% of properties were affordable for potential first home buyers in the 80th percentile.
For reference, a first home buyer in the 80th percentile means they earn a wage in the top 20% of full-time workers.
Following consecutive interest rate increases, only 30% of properties now remain affordable to such first home buyers.
A similar story is portrayed to first home buyers in the 60th percentile, with 10% of properties deemed affordable, while for those in the 40th and 20th percentile, properties are unaffordable.
The report published by the NHFIC lies in conjunction with ABS data released Monday, revealing the number of new loan commitments for first home buyers fell 3.5% in February, off the back of a 4.6% decline in January.
The ABS detailed the decline in first home buyer loan commitments in February marks the lowest level of new loan commitments since May 2017.
Across the nation, Western Australia recorded the largest decline of 7.3%, followed by South Australia at 4.9% and Victoria at 2.7%.
Advertisement
Buying a home or looking to refinance? The table below features home loans with some of the lowest interest rates on the market for owner occupiers.
| Lender | Home Loan | Interest Rate | Comparison Rate* | Monthly Repayment | Repayment type | Rate Type | Offset | Redraw | Ongoing Fees | Upfront Fees | Max LVR | Lump Sum Repayment | Extra Repayments | Split Loan Option | Tags | Features | Link | Compare | Promoted Product | Disclosure |
|---|---|---|---|---|---|---|---|---|---|---|---|---|---|---|---|---|---|---|---|---|
5.54% p.a. | 5.58% p.a. | $2,852 | Principal & Interest | Variable | $0 | $530 | 90% |
| Promoted | Disclosure | ||||||||||
5.49% p.a. | 5.40% p.a. | $2,836 | Principal & Interest | Variable | $0 | $0 | 80% |
| Promoted | Disclosure | ||||||||||
5.64% p.a. | 5.89% p.a. | $2,883 | Principal & Interest | Variable | $250 | $250 | 60% |
| Promoted | Disclosure | ||||||||||
5.64% p.a. | 5.89% p.a. | $2,883 | Principal & Interest | Variable | $248 | $350 | 60% |
| Disclosure |


")

Image by Corey Leopold via Creative Commons

Ready, Set, Buy!
Learn everything you need to know about buying property – from choosing the right property and home loan, to the purchasing process, tips to save money and more!
With bonus Q&A sheet and Crossword!


 Denise Raward
 Harry O'Sullivan
 Bea Garcia
 Rachel Horan