This means property prices have risen 3.4% since bottoming out in February.
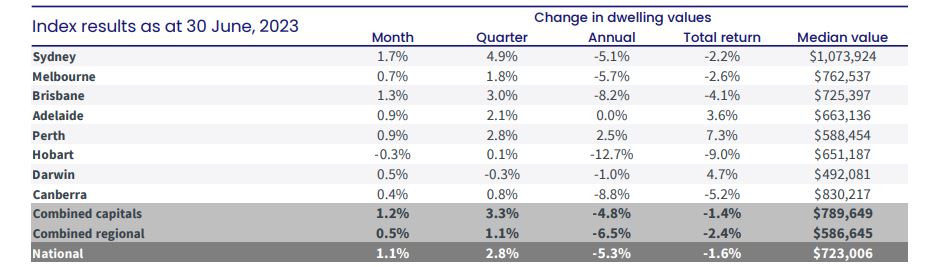
The median dwelling value for June was $723,006, which remains 6% ($45,771) lower than the peak of $768,777 in April 2022.
After the growth rate rose from 0.5% in April to 1.2% in May, June marked a slight slowdown, but all capital cities except Hobart saw property prices increase in June.
Sydney continues to lead the way with prices up another 1.7% (after rising 1.8% in May), followed by Brisbane, up 1.3% (1.4% in May), then Perth and Adelaide, which both saw the index increase by 0.9% (compared to 1.3% and 0.9% respectively in May).
Regional areas recorded a more modest 0.5% growth, the same as May, rising 1.2% in total since February.
CoreLogic's research director Tim Lawless says low supply continues to keep upward pressure on housing values.
"Through June, the flow of new capital city listings was nearly -10% below the previous five year average and total inventory levels are more than a quarter below average," Mr Lawless said.
False dawn?
Most analysts point to a supply/demand imbalance as the reason property prices have risen in recent months, defying expectations.
High immigration numbers have coincided with a lack of available properties, which Mr Lawless says has arguably been the most important factor driving prices up in recent months.
After prices dropped dramatically in the second half of 2022, this year has seen the number of new properties listed for sale persistently well below average.
This suggests many Aussie homeowners who might otherwise have sold are choosing to wait until prices get back closer to peak levels.
While you might expect supply to increase as prices crawl back up, Mr Lawless says CoreLogic isn't seeing "any signs that advertised housing stock is rising, at least at a macro level."
With the cash rate so high though (and a thirteenth increase still a possibility in tomorrow's monetary policy decision) he expects demand to drop.
"It's hard to imagine the recent pace of growth in housing values being sustained while sentiment is close to recessionary lows and the full complement of borrowers are yet to experience the rate hiking cycle in full," Mr Lawless said.
AMP Chief Economist Shane Oliver now predicts property prices to increase another 5% in the next year, but with little certainty.
"Our confidence in this forecast is low as the risk of another down leg in prices is very high as interest rate hikes continue to impact and the economy slows," he said.
"Still rising mortgage rates risk hitting home buyer demand again at the same time a collapse in economic growth and higher unemployment boosts distressed selling and helps alleviate the underlying demand/supply imbalance."
AMP believe the chance of us hitting a recession at some point in the next year is now 50/50, and the probability will increase as interest rates do.
Why prices might keep on rising
However, CoreLogic highlight several 'mitigating factors' that could keep upward pressure on prices, and offset the downside risk from high interest rates and deteriorating economic conditions.
- Record migration. The number of net migrants is expected to reach 400,000 this financial year, almost 27% above the previous record in 2008. Migrants typically rent initially, but demand is likely to spill over, while long term migrants might immediately look to buy.
- Undersupply of new properties. Just when there is a housing deficit, Australia is also in the midst of the lowest number of new building approvals in more than a decade. The National Housing Finance and Investment Corporation expect that Australia will have 175,000 fewer houses than it needs by 2027. Mr Lawless says 'such a significant under-build' is likely to keep pushing property prices up.
- Unemployment rate remaining strong. While the RBA expects Australia's unemployment rate to reach 4.5% by the end of 2024 (it was 3.6% in May), this is still a full percentage point below the decade average. If most mortgage holders keep their jobs, this could help guard against a rise in mortgage stress and default rates.
Advertisement
Buying a home or looking to refinance? The table below features home loans with some of the lowest interest rates on the market for owner occupiers.
| Lender | Home Loan | Interest Rate | Comparison Rate* | Monthly Repayment | Repayment type | Rate Type | Offset | Redraw | Ongoing Fees | Upfront Fees | Max LVR | Lump Sum Repayment | Extra Repayments | Split Loan Option | Tags | Features | Link | Compare | Promoted Product | Disclosure |
|---|---|---|---|---|---|---|---|---|---|---|---|---|---|---|---|---|---|---|---|---|
5.54% p.a. | 5.58% p.a. | $2,852 | Principal & Interest | Variable | $0 | $530 | 90% |
| Promoted | Disclosure | ||||||||||
5.49% p.a. | 5.40% p.a. | $2,836 | Principal & Interest | Variable | $0 | $0 | 80% |
| Promoted | Disclosure | ||||||||||
5.64% p.a. | 5.89% p.a. | $2,883 | Principal & Interest | Variable | $250 | $250 | 60% |
| Promoted | Disclosure | ||||||||||
5.64% p.a. | 5.89% p.a. | $2,883 | Principal & Interest | Variable | $248 | $350 | 60% |
| Disclosure |


")

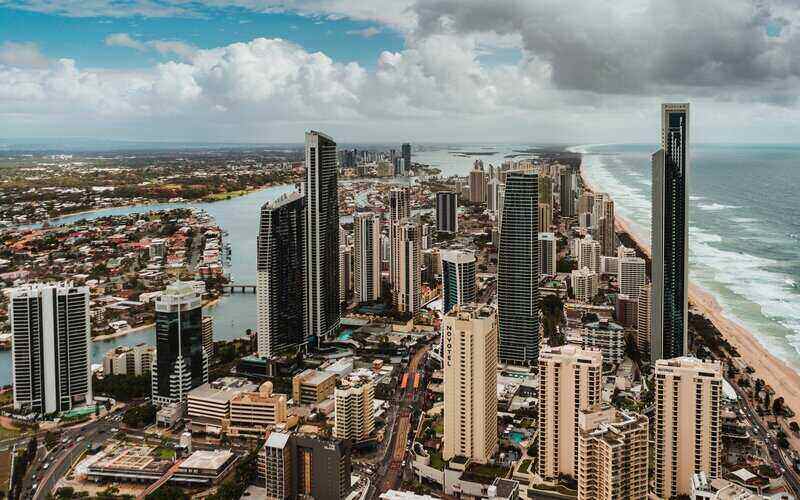
Image by Seb. via Unsplash

Ready, Set, Buy!
Learn everything you need to know about buying property – from choosing the right property and home loan, to the purchasing process, tips to save money and more!
With bonus Q&A sheet and Crossword!