CoreLogic's Home Value Index (HVI) indicates property prices rose 1.2% in May, the strongest monthly increase since November 2021.
This follows more modest growth of 0.6% and 0.5% in March and April respectively, and is the strongest sign yet that the 15-20% top to bottom fall out in property prices many experts anticipated at the start of the year may not materialise.
Strong performing capital cities were the main driver, with Sydney (up 1.8%), Brisbane (up 1.4%) and Perth (up 1.3%) all seeing particularly strong monthly growth.
Regional areas saw more modest gains of 0.5% nationwide, but all areas except regional Victoria saw property values increase through May.
Tim Lawless, CoreLogic’s research director, continues to attribute these unexpectedly positive growth trends to abnormally low levels of listings.
"Advertised listings trended lower through May with roughly 1,800 fewer capital city homes advertised for sale relative to the end of April. Inventory levels are -15.3% lower than they were at the same time last year and -24.4% below the previous five-year average for this time of year,” he said.
"With such a short supply of available housing stock, buyers are becoming more competitive and there’s an element of FOMO [fear of missing out] creeping into the market.
"Amid increased competition, auction clearance rates have trended higher, holding at 70% or above over the past three weeks."
PropTrack data also broadly showed an uplift in May, with its index rising 0.33% and 1.55% from the low point in December 2022.
Speaking to the Savings Tip Jar podcast, Ray White chief economist Nerida Conisbee said vendors are nervous.
"We're finding that there is a definite shortage of properties for sale, and it doesn't look like it's going to get better anytime soon," Ms Conisbee said.
"Sellers are a little bit nervous about the market. And we know that most sellers are subsequent buyers. One of the problems it's creating is that even though we have had all these interest rate rises, this shortage of properties on market is creating faster price growth than anyone expected."
Construction pipeline explains why
The fundamental issue is supply, with RBA cash rate rises not yet doing enough to cool demand, and 400,000 migrants arriving this year adding to the pool.
Building approvals data released Tuesday shows April posted the lowest level of approval activity since 2012, and down nearly a quarter from April 2022.
Construction data released Wednesday also shows a milquetoast residential sector.
From the December 2022 quarter to the March 2023 quarter, residential constructon was down 2.0%, and over the past 12 months is down 5.1%.
Detached house construction was down a further 1.9% over the quarter, while units are down 3.5%.
HomeBuilder - a pandemic policy - brought forward construction demand, at the expense of post-pandemic construction.
It also caused a flurry of demand at a time when tradies' ability to get supply and work done was low, according to Westpac economist Andrew Hanlan.
"Substantial policy stimulus in 2020 boosted demand and generated a sizeable pipeline of work," Mr Hanlan said.
"However, labour and material shortages represented significant supply headwinds. Spiralling costs have led to increased insolvencies in the sector.
"In addition, wet weather and flooding in the first half of 2022, delayed work."
NAB economist Tapas Strickland pointed to the data.
"The pandemic stimulus has passed, although backlogs remain high," Mr Strickland said.
"In quarter-four 2022 (the latest available data) there were 238,000 dwellings under construction, well above the 188,000 seen at the end of 2019.
"In addition there were 38,000 dwellings that had been approved, but had yet to commence construction."
A return to peak pricing?
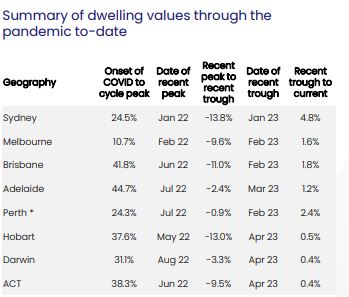
While the unexpected recent gains will have been welcomed by nervous property owners, prices in most areas remain some way short of peak early 2022 levels.
Sydney, Melbourne, Brisbane, Hobart and the ACT all saw a peak to trough fall of near or above 10%, and there is still some way to recover before prices get back close to what they were.
Perth is a notable exception - the WA capital seeing only a marginal peak to trough decline last year and has seen quarterly growth of 2%, which means as of May 2023 prices are at a record high.
Is the only way up?
Mr Lawless says it will be interesting to see if the imbalance between supply and demand continues for the rest of the year.
He has speculated that property owners are deciding against selling while the market is relatively softer, while buyers who are worried about missing out should prices rise again are getting in while they can.
This has lead to the market holding up far beyond expectations, but CoreLogic report this could mean potential sellers are encouraged by the graph pointing upwards, which may increase supply and put downward pressure on prices.
A growing concern for the RBA
A lack of supply, and heightened demand, has posed problems for the RBA and its intention to get inflation back down to target levels.
The latest monthly indicator shows it's stubborn at an annualised rate of 6.8% for April.
This was higher than the monthly indicator in March.
In front of a senate committee hearing on Wednesday, RBA Governor Dr Philip Lowe said he expects rental inflation to reach 10% by year's end.
He said the population is set to increase by 2% this year, but the housing supply will not increase by the same proportion.
"The underlying issue here is supply and demand in the rental market. The vacancy rates in many cities are very low," Governor Lowe said.
Ms Conisbee said this presents a circular headache for the RBA.
"On one hand, rents are rising very rapidly - we need more housing supply. We've also got a construction crisis. The construction industry has a shortage of workers, we need workers, but we don't have anywhere to house them. That's really problematic," Ms Conisbee said.
"Rental increases feed inflation. When inflation rises, the Reserve Bank also has to increase rates. They increase rates, that means fewer homes are bought by investors; it means a pipeline of new development gets reduced as well."
Ms Conisbee said the feedback loop might not be fixed for up to three years.
Advertisement
Buying a home or looking to refinance? The table below features home loans with some of the lowest interest rates on the market for owner occupiers.
| Lender | Home Loan | Interest Rate | Comparison Rate* | Monthly Repayment | Repayment type | Rate Type | Offset | Redraw | Ongoing Fees | Upfront Fees | Max LVR | Lump Sum Repayment | Extra Repayments | Split Loan Option | Tags | Features | Link | Compare | Promoted Product | Disclosure |
|---|---|---|---|---|---|---|---|---|---|---|---|---|---|---|---|---|---|---|---|---|
5.54% p.a. | 5.58% p.a. | $2,852 | Principal & Interest | Variable | $0 | $530 | 90% |
| Promoted | Disclosure | ||||||||||
5.49% p.a. | 5.40% p.a. | $2,836 | Principal & Interest | Variable | $0 | $0 | 80% |
| Promoted | Disclosure | ||||||||||
5.64% p.a. | 5.89% p.a. | $2,883 | Principal & Interest | Variable | $250 | $250 | 60% |
| Promoted | Disclosure | ||||||||||
5.64% p.a. | 5.89% p.a. | $2,883 | Principal & Interest | Variable | $248 | $350 | 60% |
| Disclosure |


")

Picture by Freepik

Ready, Set, Buy!
Learn everything you need to know about buying property – from choosing the right property and home loan, to the purchasing process, tips to save money and more!
With bonus Q&A sheet and Crossword!


 Harrison Astbury
 Harry O'Sullivan