Values across the country’s most affordable 25% of homes are up 2.4% over the last quarter, far outstripping growth rates of more expensive homes, according to CoreLogic’s latest data, released Thursday.
It’s a marked turnaround in the historical trend of upper quartile homes leading both upswings and downturns in the residential property market.
Data shows the upper end of the housing market led price growth in the first seven months of 2023, but slowed more sharply through the second half of the year into 2024.
The affordable end of the market is now seeing higher rates of growth in every capital city over the past quarter to February.
Perth and Adelaide lead the way
Previously, only Perth and Adelaide were seeing the lower end of the market lead the upswing in home value growth.
Perth continues to have the widest gap between lower and upper quartile value growth with a 2.2% difference.
In Adelaide, it’s 1.6% and a 1.5% difference in Brisbane.
The other capitals have narrower gaps – Sydney and Melbourne recorded a 0.7% difference, followed by 0.6% in Hobart and Darwin.
Canberra has the smallest growth rate gap between top and bottom at 0.4%.
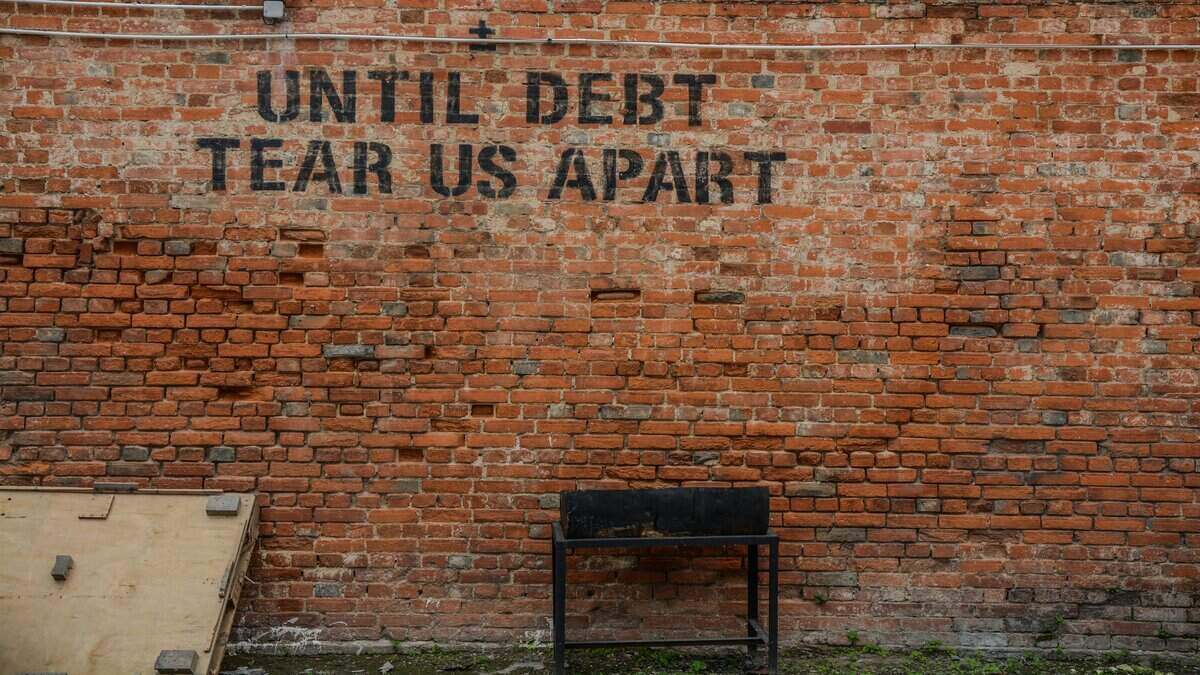
The quest for affordability
The latest home value data is in line with recent rental market research which showed rental growth rates were significantly higher at the lower end of the market as tenants searched for affordability.
The Suburbtrends report said the ongoing demand for affordable housing ultimately priced out those at the bottom.
No slowing in home values
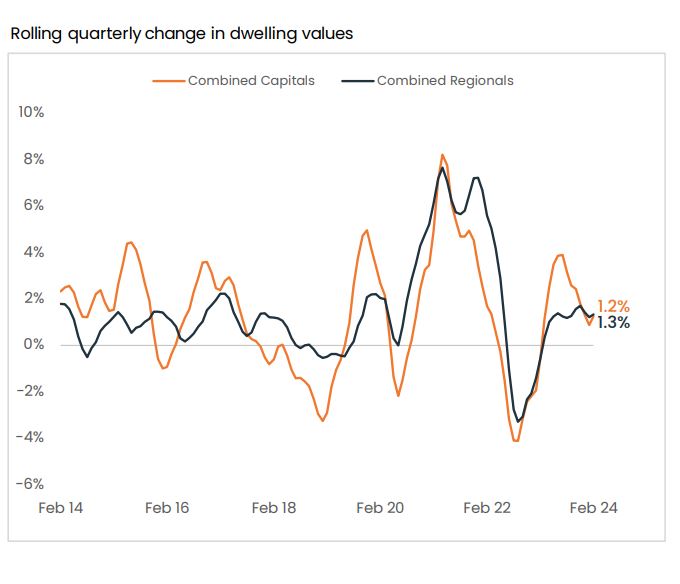
The pace of quarterly home value growth has re-accelerated to 1.3% over the three months to February, up from 1% in the three months to January.
Source: CoreLogic
The annual growth trend also ticked higher with national home values up 8.9% over the past 12 months.
This is the highest annual increase since the 2021-2022 financial year when home values rose 10.8%.
On a national basis, while home values in the lowest quartile rose 2.4%, homes in the broad middle of the market rose 1.7% while the upper quartile recorded a milder 0.6% growth.
The regional property market also shows no sign of slowing down, recording a 1.3% growth rate, edging higher than the combined capital cities at 1.2% over the quarter to February.
However, the regional market had a lower annual growth rate at 5.5%.
But it’s not all go
Around the capital cities, Perth continues to lead the rolling quarterly change in home values with 5.2% growth, followed by Adelaide at 3.6%, and Brisbane at 2.9%.
The three cities all hit record high home values in the quarter.
Sydney saw 0.6% growth, Darwin recorded a 1.6% rise, while the ACT had a more muted 0.3% rise in home values.
Home values dropped in both Hobart (-1.4%) and Melbourne (0.6%).
First home buyers hang in
Although the value of first home buyer finance fell 6% in January, first home buyers made up 28.3% of all new owner-occupied home finance.
That’s well above the average of 24.4% over the past decade.
First homeowner loan commitments also remained more than 13% above the levels recorded this time last year.
First homeowners were most active in the Western Australian and Victorian markets and least active in Queensland.
Rental rates also accelerate
In news not so good for renters trying to save home deposits, growth in home values has flowed through to the rental market which has seen a 0.9% uptick over the month of February.
This has sparked a re-acceleration in annual rental growth to 8.5% for the 12 months to February, after a recent low of 8.1% in October.
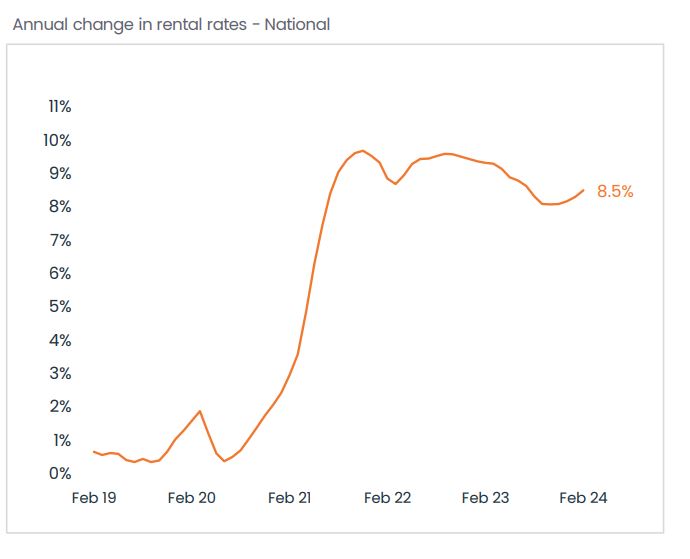
Source: CoreLogic
CoreLogic said this was likely driven by seasonal factors including the start of the academic year for universities which has historically seen rental trends accelerate in the first quarter.
Rents have risen most in Western Australia, jumping 13.9% over the past year in Perth and 12.1% in regional WA.
Melbourne has also seen a 10.8% annual rental increase, followed by Sydney at 9.4%, Adelaide at 8.7%, and Brisbane at 8.6%.
Rents rose at a more modest 3% in Darwin and dropped in Hobart and Canberra.
Investors seeing rental yield uptick
The latest data also shows a recovery in national gross rent yields in February at 3.73%, roughly in line with pre-COVID levels (3.71%).
However, five Australian capital cities have seen yields fall: Brisbane, Adelaide, Perth, Hobart, and Canberra.
Yields have risen in Darwin and Melbourne and held steady in Sydney while regional markets continued to record solid yields in February.
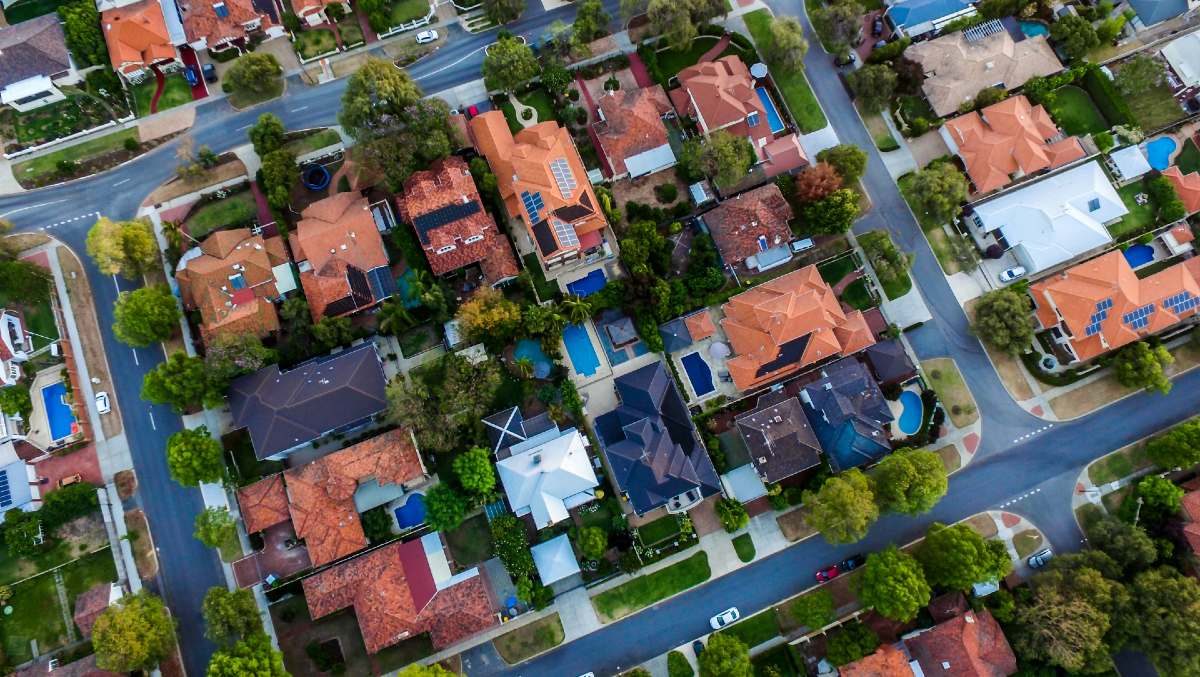
Image by Maximillian Conacher on Unsplash

Ready, Set, Buy!
Learn everything you need to know about buying property – from choosing the right property and home loan, to the purchasing process, tips to save money and more!
With bonus Q&A sheet and Crossword!

 Harrison Astbury
 Harry O'Sullivan