The Federal Chamber of Automotive Industries (FCAI) ‘VFACTS’ report revealed 96,859 vehicles were sold in July, the highest July result on record.
This is an increase of 14.7% on the same month in 2022 and breaks the previous July record of 92,754 in 2017.
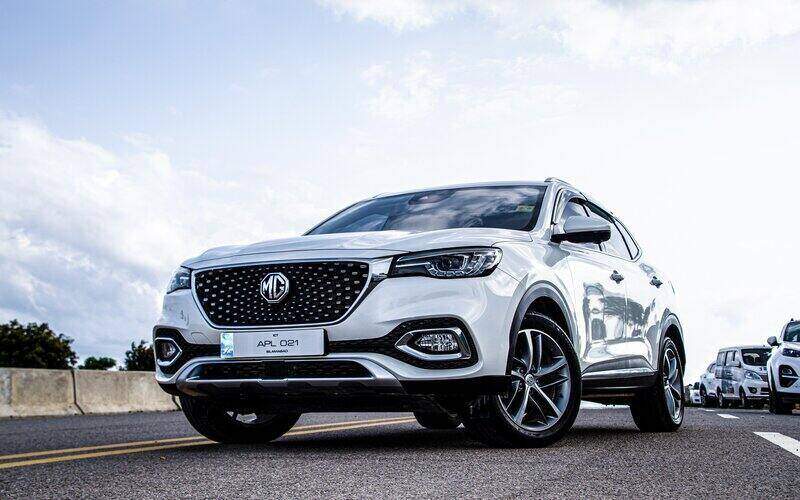
Chinese-built vehicles accounted for 16.4% of sold cars last month (15,853), an increase of 130.1% compared to the same time last year.
The MG ZS nabbed third spot in July with 3,852 sales, a 213% jump from last July’s result.
The MG ZS is one of the cheapest electric vehicles on the market.
The strong performance across all states and territories is indicative of improved supply and thus the clearing of order backlogs from the pandemic days.
FCAI Chief Executive Tony Weber said the result was an indication that the market is recovering from Covid-19 plant shutdowns, microprocessor shortages, and shipping bottlenecks.
“During the past twelve months the issue has been one of securing supply for consumers, however as these pressures ease, we are starting to see a return to more stable market conditions,” Mr Weber said.
“Many of these vehicles were ordered several months ago, so it is important to monitor the broader economic conditions through 2023 and their impact on private and business demand.”
The Ford Ranger reclaimed number one spot with 5,143 sales, ahead of the favourite Toyota Hilux with 4,670.
But when comparing the year-to-date lead, the Toyota Hilux does come back out on top with 32,763 deliveries.
Across all brands, electric vehicles accounted for 7% of the July sales.
The top 10 selling vehicles in July 2023
- Ford Ranger - 5,143
- Toyota Hilux - 4,670
- MG ZS - 3,852
- Tesla Model Y - 3,330
- Toyota RAV4 - 2,750
- Toyota Corolla - 2,145
- Toyota Landcruiser - 2,122
- Isuzu Ute D-Max - 2,070
- Hyundai i30 - 1,865
- Toyota Prado - 1,836
Advertisement
In the market for a new car? The table below features car loans with some of the lowest interest rates on the market.
| Lender | Car Loan | Interest Rate | Comparison Rate* | Monthly Repayment | Interest Type | Vehicle Type | Maximum Vehicle Age | Ongoing Fee | Upfront Fee | Total Repayment | Early Repayment | Instant Approval | Online Application | Tags | Features | Link | Compare | Promoted Product | Disclosure |
|---|---|---|---|---|---|---|---|---|---|---|---|---|---|---|---|---|---|---|---|
5.99% p.a. | 7.12% p.a. | $580 | Variable | New | No Max | $8 | $400 | $34,791 |
| Promoted | Disclosure | ||||||||
6.52% p.a. | 6.95% p.a. | $587 | Fixed | New, Used | No Max | $0 | $350 | $35,236 |
| Promoted | Disclosure | ||||||||
6.28% p.a. | 6.28% p.a. | $584 | Fixed | New | No Max | $0 | $0 | $35,034 |
| Promoted | Disclosure |


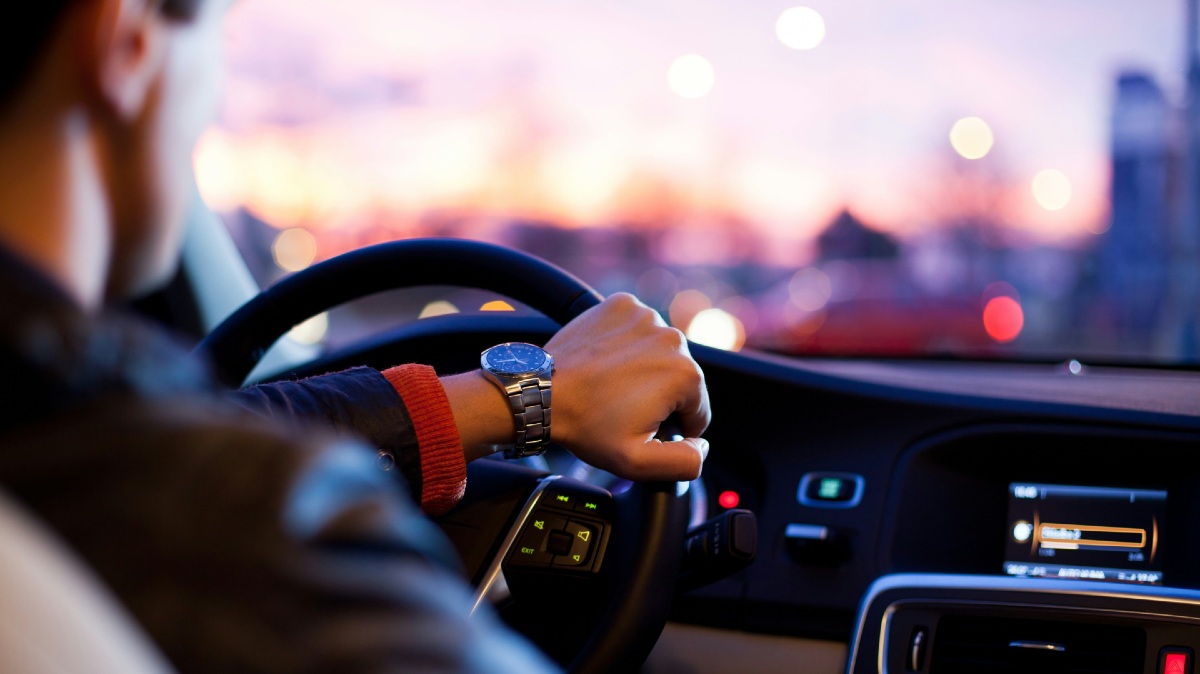
Image by ramiz haider via pexels


 Denise Raward
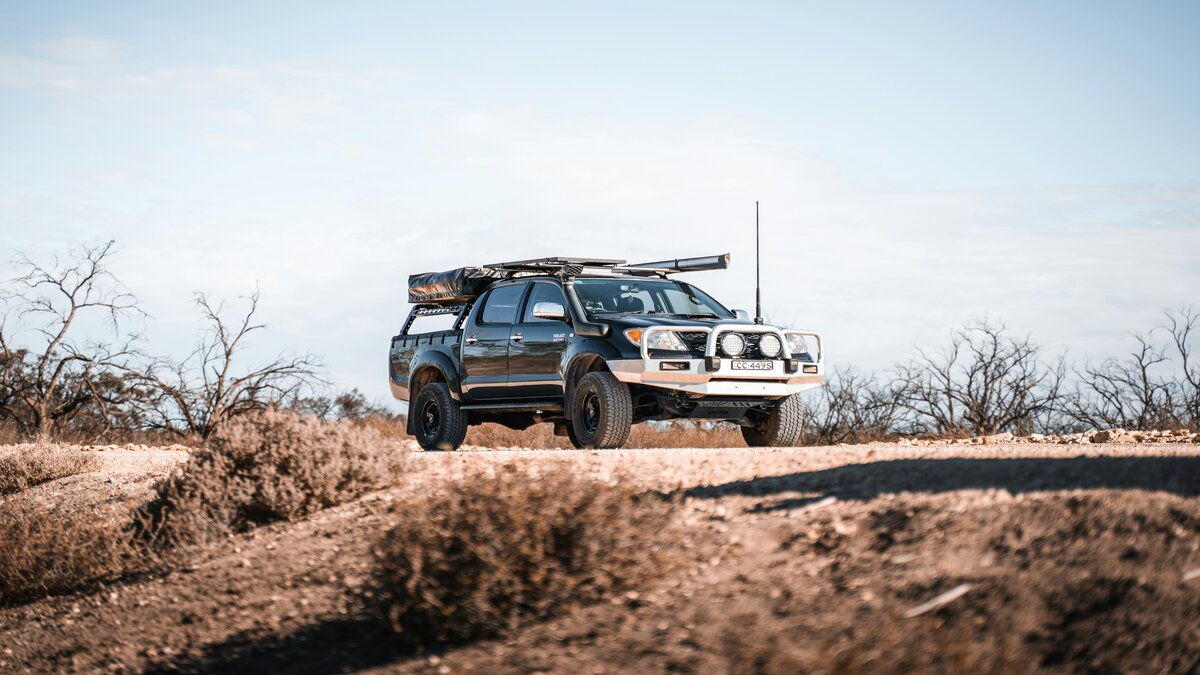
 Harry O'Sullivan
 Jacob Cocciolone
 Harrison Astbury