Domain's House Price Report has revealed that the combined capital city average house price rose over the March quarter.
Since the peak at roughly this time last year, the Australian property market has experienced a mostly uninterrupted downturn as higher interest rates reduced demand.
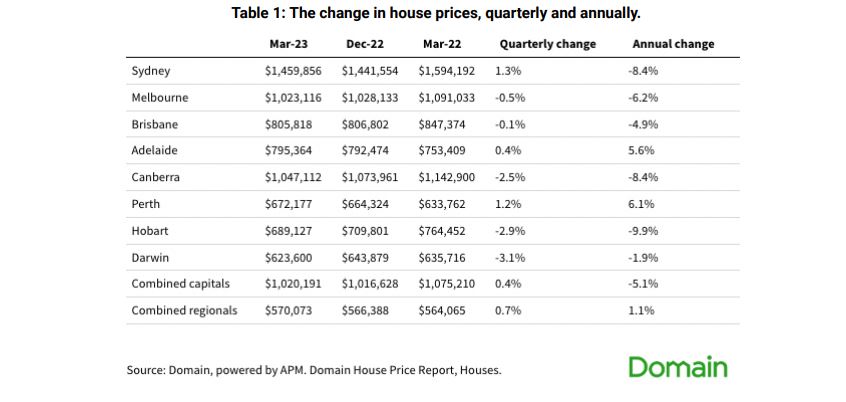
After the December quarter, the combined average capital city house price was $1,016,628, increasing to $1,075,210 by the end of March, a 0.4% increase.
This remains below the historical average of 2.6% growth.
Which areas are leading the way?
House prices in Sydney, Adelaide and Perth are up since the start of the year.
Sydney appears to have turned a corner after the steepest peak-to-trough decline on record, while the market in Perth is now at an all time high.
The markets in Melbourne and Brisbane have held steady, while the smaller capitals - Canberra, Darwin and Hobart - saw prices drop.
In Canberra and Hobart, the drop in prices was more moderate than September to December, suggesting these markets are also beginning to turn around.
Only Darwin saw the negative growth rate accelerate in the March quarter.
Dr Nicola Powell, Domain’s Chief of Research and Economics, says that this disparity is a positive sign.
"Australia’s housing market has now fully reverted back to a multi-speed market, meaning different markets are growing at different rates as they were pre-pandemic. This provides opportunities for both buyers and sellers in different locations, " Dr Powell said.
All the way back up?
March's upturn has defied popular sentiment that the property market would continue to fall throughout this year.
Except April's pause, interest rates have continued to increase, which in theory puts downward pressure on property prices with the high cost of borrowing putting prospective buyers off.
Dr Powell called this release a 'timely reminder' that interest rates are not the only determinant to the demand for property.
"Population growth is rebounding faster than anticipated, with record levels of overseas migration playing a driving role in our housing markets. Extremely tight rental markets are also making purchasing more attractive and may shift some to buy, given the current challenges of securing a lease,” she said.
Low supply has also been a key factor in keeping prices bouyant.
The number of properties for sale is almost 15% below the five year average, which is likely a byproduct of potential sellers choosing to hold while property confidence is low.
However, both PropTrack and SQM Research have recently reported an uptick in new listings.
PropTrack found there were 10.5% more new listings on realestate.com.au in March than February.
Advertisement
Buying a home or looking to refinance? The table below features home loans with some of the lowest interest rates on the market for owner occupiers.
| Lender | Home Loan | Interest Rate | Comparison Rate* | Monthly Repayment | Repayment type | Rate Type | Offset | Redraw | Ongoing Fees | Upfront Fees | Max LVR | Lump Sum Repayment | Extra Repayments | Split Loan Option | Tags | Features | Link | Compare | Promoted Product | Disclosure |
|---|---|---|---|---|---|---|---|---|---|---|---|---|---|---|---|---|---|---|---|---|
5.54% p.a. | 5.58% p.a. | $2,852 | Principal & Interest | Variable | $0 | $530 | 90% |
| Promoted | Disclosure | ||||||||||
5.49% p.a. | 5.40% p.a. | $2,836 | Principal & Interest | Variable | $0 | $0 | 80% |
| Promoted | Disclosure | ||||||||||
5.64% p.a. | 5.89% p.a. | $2,883 | Principal & Interest | Variable | $250 | $250 | 60% |
| Promoted | Disclosure | ||||||||||
5.64% p.a. | 5.89% p.a. | $2,883 | Principal & Interest | Variable | $248 | $350 | 60% |
| Disclosure |


")

Picture by R Architecture on Unsplash

Ready, Set, Buy!
Learn everything you need to know about buying property – from choosing the right property and home loan, to the purchasing process, tips to save money and more!
With bonus Q&A sheet and Crossword!