That's according to PropTrack's latest listings report, which found there were 10.5% more new listings on realestate.com.au in March than February.
That said there were 14.9% more properties for sale in March 2022.
SQM Research data paints a slightly more optimistic picture for homebuyers, reporting 249,404 listings in March - a 7.9% increase over February, and 14.2% higher than 12 months ago.
SQM Research managing director Louis Christopher said listings remain well below long-term averages.
"On previous downturns, total listings for any given month would typically rise above 300,000 properties for sale," Mr Christopher said.
"We are simply just not seeing those numbers in this cycle and it is one of the key reasons why the housing market has not corrected more than feared."
However, April could mark a return to a more balanced listings-prices equation, with CoreLogic reporting that this week saw the number of auctions - a more acute market - rebound after a quiet Easter period.
This week there are 1,780 homes going under the hammer, a marked increase from 926 in the corresponding period last year.
That said CoreLogic reported the volume of new listings in February was down 26.3% on the five year average.
CoreLogic Australia head of research Eliza Owen told the Savings Tip Jar podcast this is why prices have remained robust to start the year.
"Listings are low because people are opting to not sell their property. People get turned off selling when property prices are going down," Ms Owen said.
"Some people [might need] to reconsider whether they can actually hold on to their property at such high interest rates and then we might see more stock added to the market. But we don't see it as a flood of distressed properties.
"We see it is more a very small pool of marginal mortgage holders on low incomes who are maybe over-stretched with their borrowing are going to be the ones who might have to make those tough decisions."
The number of distressed listings also rose by a touch over 5% to 6,220 in March, according to SQM, but this remains well below pre-Covid levels.
Capital city listings breakdown
New listings in capital cities were up 10.2% from February according to Proptrack.
The number remains though some way behind March 2022, with 17.5% fewer listings, but above March '20, '19, and '18.
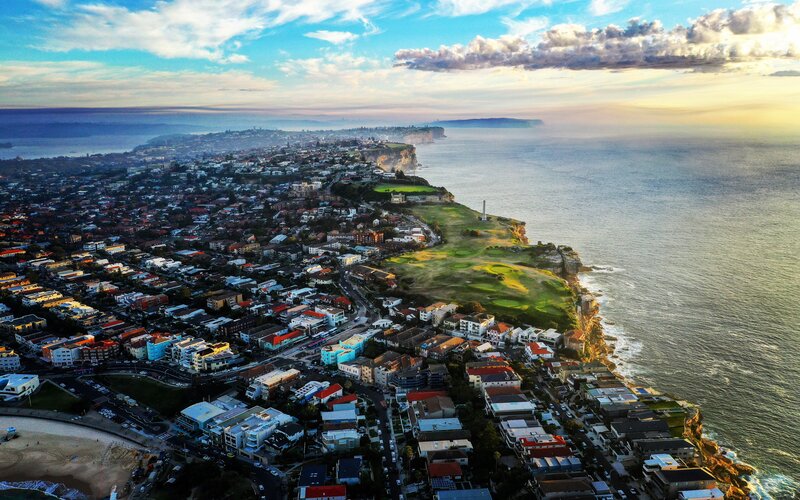
Sydney
Australia's most expensive property market saw 10.3% more new listings in March.
Sydney has had a quiet year for property so far, but this March increase means the total number of houses for sale in Sydney is now slightly above the 10 year average for this time of year.
CoreLogic reported this week 733 homes in Sydney are scheduled for auction.
This is 52.7% higher than the the 480 houses listed during the Easter period in 2022.
Melbourne
Melbourne saw slightly less sturdy growth, with new listings up 8.8% from February, but down 20.7% over the year.
CoreLogic is reporting that the week prior to Easter saw Melbourne's biggest auction week of the year.
Other capitals
| % change compared to February '23 | % change compared to March '22 | |
| Brisbane | 9.8% | -15.9% |
| Perth | 13.3% | -10.2% |
| Adelaide | 14.6% | -7.1% |
| Hobart | 5.8% | 5.4% |
| Darwin | 7.1% | -9.7% |
| Canberra | 5.2% | -15.9% |
Advertisement
Buying a home or looking to refinance? The table below features home loans with some of the lowest interest rates on the market for owner occupiers.
| Lender | Home Loan | Interest Rate | Comparison Rate* | Monthly Repayment | Repayment type | Rate Type | Offset | Redraw | Ongoing Fees | Upfront Fees | Max LVR | Lump Sum Repayment | Extra Repayments | Split Loan Option | Tags | Features | Link | Compare | Promoted Product | Disclosure |
|---|---|---|---|---|---|---|---|---|---|---|---|---|---|---|---|---|---|---|---|---|
5.54% p.a. | 5.58% p.a. | $2,852 | Principal & Interest | Variable | $0 | $530 | 90% |
| Promoted | Disclosure | ||||||||||
5.49% p.a. | 5.40% p.a. | $2,836 | Principal & Interest | Variable | $0 | $0 | 80% |
| Promoted | Disclosure | ||||||||||
5.64% p.a. | 5.89% p.a. | $2,883 | Principal & Interest | Variable | $250 | $250 | 60% |
| Promoted | Disclosure | ||||||||||
5.64% p.a. | 5.89% p.a. | $2,883 | Principal & Interest | Variable | $248 | $350 | 60% |
| Disclosure |


")

Picture by Larry Snickers on Pexels

Ready, Set, Buy!
Learn everything you need to know about buying property – from choosing the right property and home loan, to the purchasing process, tips to save money and more!
With bonus Q&A sheet and Crossword!


 Bea Garcia
 Denise Raward
 Harry O'Sullivan
 Harrison Astbury
 Rachel Horan