Contrary to expectations, the past few weeks have seen a rise in dwelling values across Australia.
CoreLogic's home value index has lifted 0.9% since early March, defying predictions that high interest rates would mean 2023 would see the property market drop by as much as 10%.
The second half of 2022 saw a large decline to property prices, as the rising cash rate constricted demand.
CoreLogic puts this down to sheer lack of supply and stock on the market, promoting more competition for the available listings.
CoreLogic is suggesting property owners are willing to wait the downturn out before selling, which has meant prices have held up strongly.
In her appearance on the Savings Tip Jar Podcast, CoreLogic head of research Eliza Owen also suggested an increase in overseas migration and a tight rental market could have contributed to the overperforming market.
"We actually saw a record volume of net overseas migration to Australia in the September quarter of last year," Ms Owen said.
"We think that with the rental market, in particular, becoming even tighter with the return of overseas migrants, that could be pivoting some decisions to maybe the purchasing market as well."
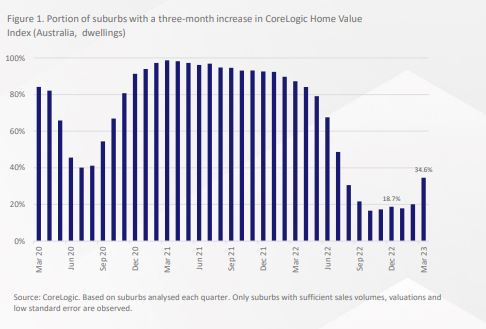
More than a third (34.6%) of Australian suburbs recorded growth in the three months to March '23, compared to 19% over the December quarter and just 16.5% in the three months to October '22.
The areas driving growth
Both capital cities (up 32.6%) and regional markets (up 37.4%) were represented in the upswing.
Sydney (up 43.9%) and Perth (up 57.3%) were the capital cities that saw the most substantial growth.
However, Eliza Owen says that the growth dynamics in the two cities are very different.
"Sydney dwellings are showing signs of a rebound, following a peak-to-trough decline of around -14% over the year to January," Ms Owen said.
Meanwhile, growth in Perth is part of a broader, more consistent growth trend over the past few years.
"If Sydney is leading capital cities out of a downswing, Perth has yet to go through one," Ms Owen said.
| Capital City | No. of Suburbs where values rose | % of suburbs with rising value |
| Sydney | 271 | 43.9% |
| Melbourne | 75 | 19.3% |
| Brisbane | 48 | 14.2% |
| Perth | 169 | 57.3% |
| Adelaide | 112 | 34.5% |
| Hobart | 2 | 5.1% |
| Darwin | 12 | 27.9% |
| Canberra | 11 | 11.1% |
Best performing suburbs nationally
Regional suburbs dominated Core Logic's list of the suburbs that recorded the biggest growth in March.
Notably, the price level in many of these suburbs is well below the national median.
The five suburbs from capital cities all came from prestige markets in Sydney, where the median price is above $1 million.
These affluent Northern Sydney suburbs tend to have a higher than average owner occupied rate compared to the rest of Sydney.
Over three quarters (76%) of Northern Shores and Northern Sydney suburbs are owner occupied, compared to 63% for the whole of Greater Sydney.
The top ten
| Suburb | Area | Median value | Quarterly change |
| Robe | Rest of SA | $569,501 | 8.3% |
| Dinner Plain | Rest of Vic. | $1,052,121 | 8.0% |
| Trangie | Rest of NSW | $228,371 | 7.4% |
| Werris Creek | Rest of NSW | $275,274 | 7.1% |
| Kalbarri East | Rest of WA | $327,906 | 6.9% |
| Killara | Greater Sydney | $3,483,271 | 6.8% |
| Cervantes | Rest of WA | $414,101 | 6.6% |
| Port Douglas | Rest of Qld | $496,823 | 6.6% |
| Middle Cove | Greater Sydney | $3,353,226 | 6.4% |
| Warrawee | Greater Sydney | $2,439,941 | 6.4% |
Hobart, once the property darling is no more
CoreLogic reported that Hobart is generally defying trends seen in other capital cities, undoing some growth seen over the past few years.
"Hobart had just two suburbs that saw dwelling value increases in the quarter, as the city has moved through a steep peak-to-current decline of -12.9%," Ms Owen said.
"Steep price falls in the city follow more than seven years of almost un-interrupted growth, so it is somewhat unsurprising to see such an extended, broad-based decline."
Advertisement
Buying a home or looking to refinance? The table below features home loans with some of the lowest interest rates on the market for owner occupiers.
| Lender | Home Loan | Interest Rate | Comparison Rate* | Monthly Repayment | Repayment type | Rate Type | Offset | Redraw | Ongoing Fees | Upfront Fees | Max LVR | Lump Sum Repayment | Extra Repayments | Split Loan Option | Tags | Features | Link | Compare | Promoted Product | Disclosure |
|---|---|---|---|---|---|---|---|---|---|---|---|---|---|---|---|---|---|---|---|---|
5.54% p.a. | 5.58% p.a. | $2,852 | Principal & Interest | Variable | $0 | $530 | 90% |
| Promoted | Disclosure | ||||||||||
5.49% p.a. | 5.40% p.a. | $2,836 | Principal & Interest | Variable | $0 | $0 | 80% |
| Promoted | Disclosure | ||||||||||
5.64% p.a. | 5.89% p.a. | $2,883 | Principal & Interest | Variable | $250 | $250 | 60% |
| Promoted | Disclosure | ||||||||||
5.64% p.a. | 5.89% p.a. | $2,883 | Principal & Interest | Variable | $248 | $350 | 60% |
| Disclosure |


")

Picture by Leigh on Unsplash

Ready, Set, Buy!
Learn everything you need to know about buying property – from choosing the right property and home loan, to the purchasing process, tips to save money and more!
With bonus Q&A sheet and Crossword!