The REA Group PropTrack Rental Report September 2022 revealed the number of properties listed for rent on realestate.com.au declined 20.5% year-on-year in September.
This is the lowest level recorded since mid-2003; the current national rental vacancy rate is sitting at a historic low of 1.6%
Due to restricted stock and tight competition, rental prices have been pushed up by 4.3% in the September quarter.
The tight conditions driving rental price growth are set to continue in capital cities, though some of the heat has begun to come out of the regional market.
This comes as a market insight report from PropTrack found the share of properties listed for rent on realestate.com.au for less than $400 per week fell to a record low of 19.3% of listings - declining from 41.8% in March 2020.
According to the report, this number will only fall further as the rental market tightens in preparation for a migration increase.
New lending to investors recorded a decline in August 2022, the lowest value since June 2021 and 23.9% below its recent peak.
The lack of investor action is resulting in fewer investment properties being purchased, which is exacerbating the supply pinch.
"With fewer investors purchasing homes to rent out, the limited supply of stock, coupled with strong demand, is leading to heightened increases in advertised rental prices," said Cameron Kusher, PropTrack Director of Economic Research.
The median number of days a property was listed for rent on realestate.com.au was 19 days in September.
@savings.com.au Australia’s rental crisis continues to move into precarious territory. For all the latest property market news, head to savings.com.au #fintok #fintokaustralia #property #propertyaustralia #propertymarket #rentalproperty #rentalcrisisaustralia ♬ original sound - Savings.com.au
More dollars for dwellings
SQM Research data to the week ending 20 October showed a sharp uptick in rental prices over the rolling month.
In Sydney, for example, rental prices were up 2.3% for units to $571.48 a week and up 2.0% for houses to $865.09 a week.
Overall Sydney rental prices are up 26.7% over the past 12 months, and nationally are up 1.7% on the month and 22.4% over 12 months.
Investors selling up - has that contributed to the rental crisis?
PRD Chief Economist Dr Diaswati Mardiasmo said the mass exodus of investors from the property market during the pandemic certainly impacted rental supply.
“A lot of investors exited during Covid as they felt that they were hard done by as there was very little protection for them,” Dr Mardiasmo told The Savings Tip Jar podcast.
“Yes, you could freeze your mortgage, but it actually meant that you were just going to be paying more at the end because the interest rate will keep on compounding.
“So for investors, that didn’t make financial sense and therefore a lot of investors tapped out of the market.”
Recent hikes to the cash rate and rising cost of living have also had investors seriously consider whether they should sell their properties.
“At the moment, there’s a lot of investors debating whether or not they’re going to be tapping out of the market because of the cash rate hikes,” Dr Mardiasmo explained.
“They’re deciding whether or not it’s going to be financially viable for them to actually keep their investment.
“Council rates and insurance premiums are also going up so all of that compounds to whether or not an investor decides to tap out or stay in.”
Is there a solution?
Mr Kusher said the solution to the current tight rental market is either more rental supply or less rental demand, or a combination of both.
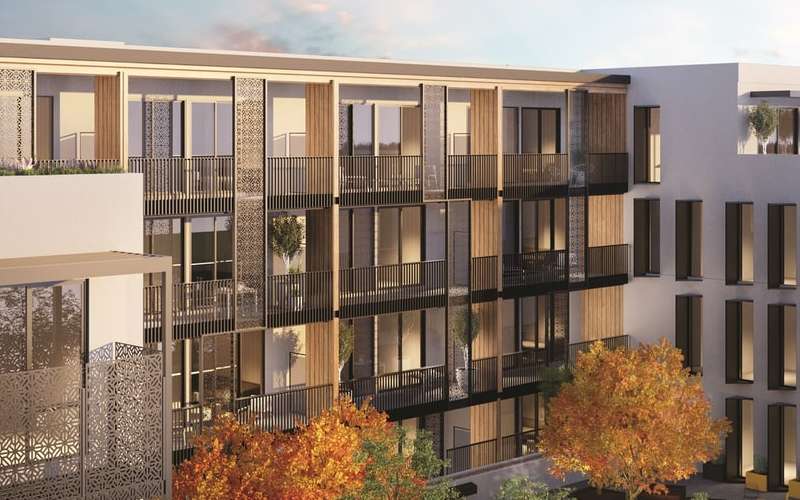
“While there is some supply coming via build-to-rent, any supply additions are expected to be well and truly outweighed by the increase in demand from the re-opening of international borders and the ongoing decline in purchasing by first home buyers,” he said.
“These demand and supply issues can be addressed but none of these factors appear set to change in the near-term, which means a further tightening of rental supply and increases in rental costs seems likely over the coming year.”
Could Labor’s Housing Accord be a game changer for the rental crisis?
The first budget delivered by the Albanese Labor Government introduced the National Housing Accord, set to build affordable homes to help tackle housing supply woes.
The National Housing Accord is set to build one million new homes over five years from 2024, off the back of the government providing $350 million in total over the same period.
Along with institutional investment, each state and territory is also chipping in $350 million apiece.
“Supply hasn’t kept up with demand, which means too many people struggle to live close to where they work,” said Jim Chalmers, Treasurer of Australia.
“We want affordable rental properties as many families are struggling to keep up.”
Housing Industry Association’s (HIA) Managing Director Graham Wolfe said Labor’s first budget shows leadership to tackle Australia’s housing supply and affordability challenges for all Australians.
“For every year that Australia doesn’t deliver enough new homes to meet demand across the housing continuum, we will see a negative impact on both housing affordability and rental affordability,” Mr Wolfe said.
“HIA welcomes the opportunity to be part of the Housing Accord and identify ways to maintain a stable level of housing supply across the housing continuum, putting housing supply front and centre.
“The budget commitment of $10 billion to create the Housing Australians Future Fund which aims to deliver 30,000 social and affordable rental homes, has the capacity to bridge the housing deficit.”
While most of the property sector has welcomed the focus on increasing supply, some concerns have been raised.
According to research firm Propertyology, government-funded rental accommodation in Australia is currently 100,000 less than 30-years ago.
Head of Research of InvestorKit Arjun Paliwal said while it’s great to see housing supply as a key part of the conversation, the plans will not be enough to curb the rental crisis or help first home buyers.
"An announcement of 10,000 places here and there or similar building trends over the last five years being repeated isn’t enough," Mr Paliwal said.
"Many fail to understand that we are to see circa 200,000 incoming migrants with the cap lift each year and that Australia typically sees 450,000-550,000 housing transactions per year."
Image by Aida Poppy via Pixabay

Ready, Set, Buy!
Learn everything you need to know about buying property – from choosing the right property and home loan, to the purchasing process, tips to save money and more!
With bonus Q&A sheet and Crossword!

 William Jolly
 Harry O'Sullivan