The rebirth of Australia’s economy continues to see downward pressure placed upon the national vacancy rate as Australians are faced with the prospects of fewer lockdowns, greater job security and travelling freely.
The monthly rental vacancy report published by Domain shows vacancy rates remain consistent across Darwin, Adelaide and Hobart throughout October.
For the remaining Australian capital cities, Melbourne, Sydney, Canberra, Perth and Brisbane all showed declines in vacancy rates throughout October.
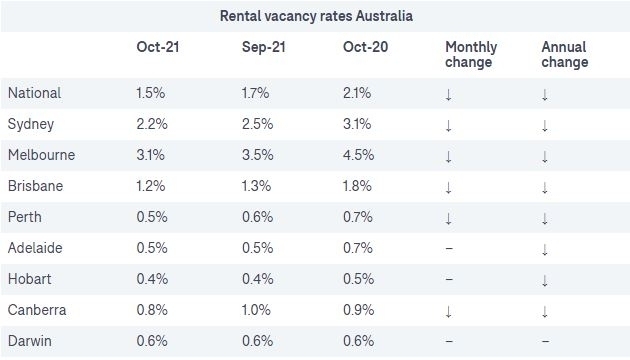
In Sydney off the back of their first vacancy rate decrease in two months, vacancy rates are at their lowest point since May 2018, falling from 2.5% to 2.2% in October.
Melbourne’s vacancy rates are at their lowest point since July 2020, falling from 3.5% to 3.1% in October.
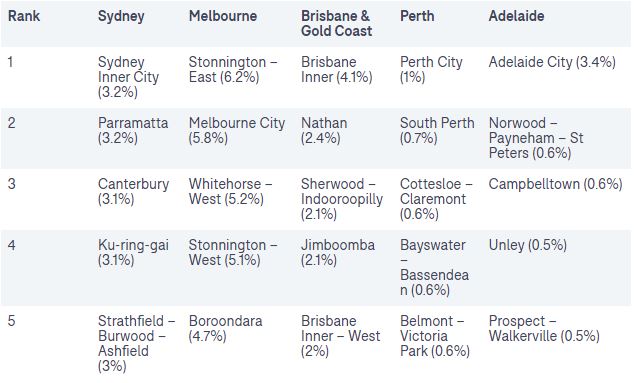
Moving away from lockdowns, Melbourne City was highlighted by Domain as the region with the largest decline in vacancy rates between September and October, from 6.8% to 5.7%.
Further, Domain highlighted Melbourne regions occupied seven of the ten positions with the largest monthly decline in vacancy rate between September and October, including:
-
Melbourne City
-
Maribyrnong
-
Blacktown North
-
Brimbank
-
Monash
-
Brunswick - Coburg
-
Banyule
Majority of markets remain in favour of landlords
Supply will continue to fall meaning more people will battle for fewer rental listings according to Domain.
For tenants across the nation, rental markets outside of Sydney and Melbourne remain 'in favour' of landlords.
Domain points out this means upward pressure on asking rents and better rental yields moving forward for landlords, forecasting Sydney will soon follow the trend towards a landlord market.
For Melbourne on the other hand, Domain notes the capital will continue to remain a tenants market for the near future given vacancy rates remain considerably higher at 5.8%, when compared to other capitals across the nation.
SQM Research reported both Sydney and Melbourne cities experienced a significant leap in listings of 25.5% and 25.1% respectively up from Septembe - attributed to the end of lockdowns.
SQM Research noted this is the largest single percentage increase (month on month of total listings) recorded for Sydney and the second largest single percentage increase (month on month of total listings) for Melbourne.
Managing Director of SQM Research Louis Christopher said October is seasonally a strong month for new listings, however increasing chatter about future interest rate rises and intervention by APRA, could see an increasing number of vendors looking to sell.
"If we see similar strong listing activity in November, it will test the absorption rates and may point to a peak in the housing market," Mr Christopher said.
Image by Chris Robert via Unsplash.

Ready, Set, Buy!
Learn everything you need to know about buying property – from choosing the right property and home loan, to the purchasing process, tips to save money and more!
With bonus Q&A sheet and Crossword!


 Bernadette Lunas
 Denise Raward
 Harry O'Sullivan
 Emma Duffy