Properties are seemingly not being built or released on the market anywhere near the rate of rental demand, driving vacancy rates across the nation to near record lows, and prices up.
Rate rises to mortgages may also have a flow-on effect to rents.
SQM Research has found average weekly rent in Australia went up more than 15% in 2022.
This week, PropTrack published the suburbs across the country that have seen the biggest annual increase to median rents (from February '22 to '23), which we've broken down state by state, with 160 suburbs or towns detailed.
New South Wales
House prices
|
Suburb |
GCCSA |
Current median weekly rent |
$ change in median rental price |
|---|---|---|---|
|
Clovelly |
Greater Sydney |
$1,995 |
$633 |
|
Rose Bay |
Greater Sydney |
$2,000 |
$600 |
|
Middle Cove |
Greater Sydney |
$1,700 |
$525 |
|
Riverview |
Greater Sydney |
$1,450 |
$400 |
|
Double Bay |
Greater Sydney |
$2,000 |
$400 |
|
Vaucluse |
Greater Sydney |
$2,995 |
$395 |
|
Balmain East |
Greater Sydney |
$1,400 |
$375 |
|
Curl Curl |
Greater Sydney |
$1,900 |
$375 |
|
North Turramurra |
Greater Sydney |
$1,250 |
$355 |
|
Queens Park |
Greater Sydney |
$1,650 |
$350 |
Unit prices
|
Suburb |
GCCSA |
Current median weekly rent |
$ change in median rental price |
|---|---|---|---|
|
Caringbah South |
Greater Sydney |
$980 |
$230 |
|
Eveleigh |
Greater Sydney |
$838 |
$208 |
|
Millers Point |
Greater Sydney |
$840 |
$180 |
|
Haymarket |
Greater Sydney |
$850 |
$170 |
|
South Granville |
Greater Sydney |
$443 |
$163 |
|
Soldiers Point |
Rest of NSW |
$550 |
$163 |
|
Glendale |
Rest of NSW |
$450 |
$150 |
|
Sylvania |
Greater Sydney |
$650 |
$150 |
|
Zetland |
Greater Sydney |
$780 |
$150 |
|
Brunswick Heads |
Rest of NSW |
$690 |
$140 |
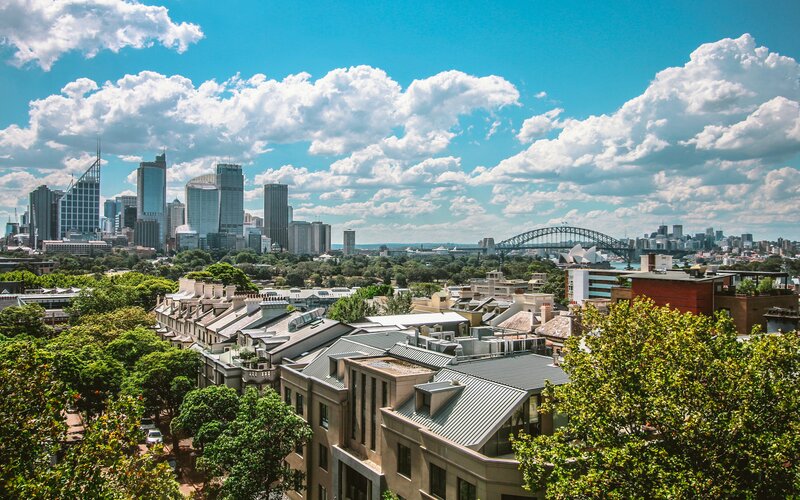
NSW saw the biggest spikes to rental rates.
Seven of the top ten biggest increases to rents for both houses and units in the whole country were suburbs in Sydney, while Glendale and Soliders Point also made it onto the list for units.
Median rents in Clovelly and Rose Bay increased by over $600.
Victoria
House prices
|
Suburb |
GCCSA |
Current median weekly rent |
$ change in median rental price |
|---|---|---|---|
|
Black Rock |
Greater Melbourne |
$ 1,075 |
$180 |
|
Somers |
Greater Melbourne |
$650 |
$175 |
|
Sorrento |
Greater Melbourne |
$970 |
$171 |
|
St Kilda West |
Greater Melbourne |
$1,045 |
$170 |
|
Blairgowrie |
Greater Melbourne |
$698 |
$158 |
|
Caulfield |
Greater Melbourne |
$850 |
$150 |
|
Glen Huntly |
Greater Melbourne |
$780 |
$140 |
|
Echuca |
Rest of Vic. |
$550 |
$130 |
|
Ormond |
Greater Melbourne |
$750 |
$130 |
|
Bright |
Rest of Vic. |
$575 |
$125 |
Unit prices
|
Suburb |
GCCSA |
Current median weekly rent |
$ change in median rental price |
|---|---|---|---|
|
Melbourne |
Greater Melbourne |
$530 |
$150 |
|
Southbank |
Greater Melbourne |
$550 |
$130 |
|
West Melbourne |
Greater Melbourne |
$500 |
$120 |
|
McCrae |
Greater Melbourne |
$550 |
$120 |
|
Docklands |
Greater Melbourne |
$550 |
$110 |
|
Healesville |
Greater Melbourne |
$470 |
$105 |
|
Rye |
Greater Melbourne |
$490 |
$90 |
|
Wheelers Hill |
Greater Melbourne |
$520 |
$90 |
|
Torquay |
Rest of Vic. |
$550 |
$90 |
|
Dromana |
Greater Melbourne |
$505 |
$80 |
While vacancy rates in Victoria fell from 2.8% to 1.1% over the year according to SQM, Australia's second largest state did not see the dramatic price increases that NSW experienced.
The Victorian government outlawed rental bidding (where real estate agents encourage prospective tenants to bid over the asking price) in 2021, while the same measures weren't implemented in NSW until December 2022.
By no means is Victoria avoiding the rental crisis though, with several suburbs seeing large relative growth.
Median rental price for houses in Somers rose nearly 37%, for example, while units in Healesville are now 28% more expensive to rent.
Queensland
House prices
|
Suburb |
GCCSA |
Current median weekly rent |
$ change in median rental price |
|---|---|---|---|
|
Surfers Paradise |
Rest of Qld |
$1,475 |
$430 |
|
Paradise Point |
Rest of Qld |
$1,275 |
$425 |
|
Clear Island Waters |
Rest of Qld |
$1,400 |
$400 |
|
Miami |
Rest of Qld |
$1,100 |
$310 |
|
Sunshine Beach |
Rest of Qld |
$1,175 |
$275 |
|
Jacobs Well |
Rest of Qld |
$810 |
$235 |
|
New Farm |
Greater Brisbane |
$1,080 |
$230 |
|
North Maclean |
Greater Brisbane |
$680 |
$220 |
|
Tanawha |
Rest of Qld |
$1,050 |
$200 |
|
Mermaid Waters |
Rest of Qld |
$1,100 |
$200 |
Unit prices
|
Suburb |
GCCSA |
Current median weekly rent |
$ change in median rental price |
|---|---|---|---|
|
Banksia Beach |
Greater Brisbane |
$610 |
$160 |
|
Main Beach |
Rest of Qld |
$700 |
$150 |
|
Mermaid Beach |
Rest of Qld |
$700 |
$145 |
|
Elanora |
Rest of Qld |
$690 |
$140 |
|
Hollywell |
Rest of Qld |
$720 |
$140 |
|
Peregian Beach |
Rest of Qld |
$650 |
$130 |
|
Banyo |
Greater Brisbane |
$460 |
$119 |
|
Durack |
Greater Brisbane |
$505 |
$115 |
|
Merrimac |
Rest of Qld |
$610 |
$110 |
|
Broadbeach |
Rest of Qld |
$620 |
$110 |
Earlier this week, Queensland premier Annastascia Palaszczuk said the government would seriously consider introducing caps on rental rises to combat chronic housing shortages across the state.
This proposal came under heavy fire from many within the real estate industry, who say the move would see investors pull out of property, which would further limit the rental supply.
Tenants in Queensland though will likely be hoping for something to change, with several suburbs sneaking into the top ten for increases to median rents in Australia.
ACT
House prices
|
Suburb |
GCCSA |
Current median weekly rent |
$ change in median rental price |
|---|---|---|---|
|
Kingston |
Australian Capital Territory |
$1100 |
$250 |
|
Garran |
Australian Capital Territory |
$840 |
$140 |
|
Deakin |
Australian Capital Territory |
$950 |
$137.5 |
|
Pearce |
Australian Capital Territory |
$780 |
$130 |
|
Hawker |
Australian Capital Territory |
$685 |
$115 |
|
Turner |
Australian Capital Territory |
$882.5 |
$102.5 |
|
Theodore |
Australian Capital Territory |
$630 |
$100 |
|
Forrest |
Australian Capital Territory |
$1500 |
$100 |
|
Bruce |
Australian Capital Territory |
$745 |
$95 |
|
Hughes |
Australian Capital Territory |
$735 |
$85 |
Unit prices
|
Suburb |
GCCSA |
Current median weekly rent |
$ change in median rental price |
|---|---|---|---|
|
Moncrieff |
Australian Capital Territory |
$630 |
$95 |
|
Wanniassa |
Australian Capital Territory |
$530 |
$85 |
|
Jacka |
Australian Capital Territory |
$565 |
$85 |
|
Holder |
Australian Capital Territory |
$580 |
$82.5 |
|
Garran |
Australian Capital Territory |
$680 |
$80 |
|
Hawker |
Australian Capital Territory |
$470 |
$72.5 |
|
Ngunnawal |
Australian Capital Territory |
$555 |
$72.5 |
|
Holt |
Australian Capital Territory |
$520 |
$70 |
|
Pearce |
Australian Capital Territory |
$570 |
$70 |
|
Narrabundah |
Australian Capital Territory |
$590 |
$70 |
The ACT is the only state or territory to already have controls on rental increases in place.
Annual rent increases can only be up to 10% more than the quarterly inflation rate of rents in the ACT.
This likely explains why the ACT saw comparatively lower rental increases than other areas of Australia.
South Australia
House prices
|
Suburb |
GCCSA |
Current median weekly rent |
$ change in median rental price |
|---|---|---|---|
|
Glen Osmond |
Greater Adelaide |
$900 |
$270 |
|
Walkerville |
Greater Adelaide |
$790 |
$190 |
|
Glenelg East |
Greater Adelaide |
$650 |
$175 |
|
Stirling |
Greater Adelaide |
$680 |
$170 |
|
Hazelwood Park |
Greater Adelaide |
$770 |
$170 |
|
Medindie |
Greater Adelaide |
$1,045 |
$170 |
|
West Lakes Shore |
Greater Adelaide |
$700 |
$155 |
|
Malvern |
Greater Adelaide |
$838 |
$148 |
|
Kensington Gardens |
Greater Adelaide |
$690 |
$145 |
|
Glenunga |
Greater Adelaide |
$825 |
$145 |
Unit Prices
|
Suburb |
GCCSA |
Current median weekly rent |
$ change in median rental price |
|---|---|---|---|
|
Woodville West |
Greater Adelaide |
$425 |
$90 |
|
Westbourne Park |
Greater Adelaide |
$380 |
$80 |
|
Glenunga |
Greater Adelaide |
$420 |
$80 |
|
Seacliff |
Greater Adelaide |
$430 |
$80 |
|
St Morris |
Greater Adelaide |
$430 |
$80 |
|
Tonsley |
Greater Adelaide |
$363 |
$80 |
|
Henley Beach |
Greater Adelaide |
$425 |
$75 |
|
Campbelltown |
Greater Adelaide |
$425 |
$75 |
|
Renown Park |
Greater Adelaide |
$380 |
$73 |
|
Sefton Park |
Greater Adelaide |
$400 |
$70 |
Western Australia
House prices
|
Suburb |
GCCSA |
Current median weekly rent |
$ change in median rental price |
|---|---|---|---|
|
Salter Point |
Greater Perth |
$795 |
$220 |
|
East Perth |
Greater Perth |
$750 |
$200 |
|
Attadale |
Greater Perth |
$800 |
$200 |
|
North Coogee |
Greater Perth |
$1150 |
$200 |
|
Banjup |
Greater Perth |
$850 |
$187.5 |
|
Woodlands |
Greater Perth |
$737.5 |
$175 |
|
Coolbinia |
Greater Perth |
$720 |
$165 |
|
Busselton |
Rest of WA |
$600 |
$155 |
|
North Lake |
Greater Perth |
$620 |
$150 |
|
South Perth |
Greater Perth |
$750 |
$150 |
Unit prices
|
Suburb |
GCCSA |
Current median weekly rent |
$ change in median rental price |
|---|---|---|---|
|
North Fremantle |
Greater Perth |
$720 |
$120 |
|
Cable Beach |
Rest of WA |
$500 |
$100 |
|
South Hedland |
Rest of WA |
$600 |
$100 |
|
Dampier |
Rest of WA |
$515 |
$95 |
|
Cottesloe |
Greater Perth |
$595 |
$95 |
|
Parmelia |
Greater Perth |
$325 |
$90 |
|
Geographe |
Rest of WA |
$525 |
$90 |
|
Eaton |
Rest of WA |
$435 |
$87.5 |
|
Wannanup |
Greater Perth |
$550 |
$85 |
|
Port Hedland |
Rest of WA |
$600 |
$82.5 |
Tasmania
House prices
|
Suburb |
GCCSA |
Current median weekly rent |
$ change in median rental price |
|---|---|---|---|
|
Montello |
Rest of Tas. |
$405 |
$100 |
|
Hadspen |
Rest of Tas. |
$540 |
$100 |
|
Mount Stuart |
Greater Hobart |
$648 |
$98 |
|
Geilston Bay |
Greater Hobart |
$625 |
$95 |
|
Montrose |
Greater Hobart |
$590 |
$90 |
|
Battery Point |
Greater Hobart |
$700 |
$90 |
|
Legana |
Rest of Tas. |
$560 |
$88 |
|
Lauderdale |
Greater Hobart |
$620 |
$83 |
|
Sandy Bay |
Greater Hobart |
$700 |
$75 |
|
Longford |
Rest of Tas. |
$500 |
$70 |
Unit prices
|
Suburb |
GCCSA |
Current median weekly rent |
$ change in median rental price |
|---|---|---|---|
|
New Norfolk |
Greater Hobart |
$400 |
$100 |
|
Kingston Beach |
Greater Hobart |
$510 |
$80 |
|
Warrane |
Greater Hobart |
$530 |
$80 |
|
Newstead |
Rest of Tas. |
$410 |
$78 |
|
George Town |
Rest of Tas. |
$270 |
$70 |
|
Blackmans Bay |
Greater Hobart |
$520 |
$70 |
|
Newnham |
Rest of Tas. |
$368 |
$68 |
|
Bridgewater |
Greater Hobart |
$398 |
$68 |
|
Huonville |
Rest of Tas. |
$410 |
$60 |
|
Norwood |
Rest of Tas. |
$430 |
$60 |
Northern Territory
House prices
|
Suburb |
GCCSA |
Current median weekly rent |
$ change in median rental price |
|---|---|---|---|
|
Larrakeyah |
Greater Darwin |
$1100 |
$250 |
|
Coconut Grove |
Greater Darwin |
$755 |
$115 |
|
Wagaman |
Greater Darwin |
$635 |
$110 |
|
Stuart Park |
Greater Darwin |
$765 |
$85 |
|
Tiwi |
Greater Darwin |
$580 |
$80 |
|
Alawa |
Greater Darwin |
$595 |
$75 |
|
Millner |
Greater Darwin |
$600 |
$60 |
|
Rapid Creek |
Greater Darwin |
$687.5 |
$57.5 |
|
Woodroffe |
Greater Darwin |
$550 |
$50 |
|
Rosebery |
Greater Darwin |
$650 |
$50 |
Unit prices
|
Suburb |
GCCSA |
Current median weekly rent |
$ change in median rental price |
|---|---|---|---|
|
Nightcliff |
Greater Darwin |
$450 |
$70 |
|
Larrakeyah |
Greater Darwin |
$570 |
$70 |
|
Berrimah |
Greater Darwin |
$600 |
$70 |
|
Zuccoli |
Greater Darwin |
$600 |
$67.5 |
|
Rapid Creek |
Greater Darwin |
$475 |
$65 |
|
Parap |
Greater Darwin |
$530 |
$60 |
|
Stuart Park |
Greater Darwin |
$550 |
$60 |
|
Braitling |
Rest of NT |
$435 |
$50 |
|
Leanyer |
Greater Darwin |
$450 |
$50 |
|
Woolner |
Greater Darwin |
$550 |
$50 |
Picture by Belle Co on Pexels

Ready, Set, Buy!
Learn everything you need to know about buying property – from choosing the right property and home loan, to the purchasing process, tips to save money and more!
With bonus Q&A sheet and Crossword!

 Harry O'Sullivan
 Brooke Cooper