The strong results have nudged the national index into positive annual growth territory for the first time since April 2018, with dwelling values up 0.1% over the past 12 months.
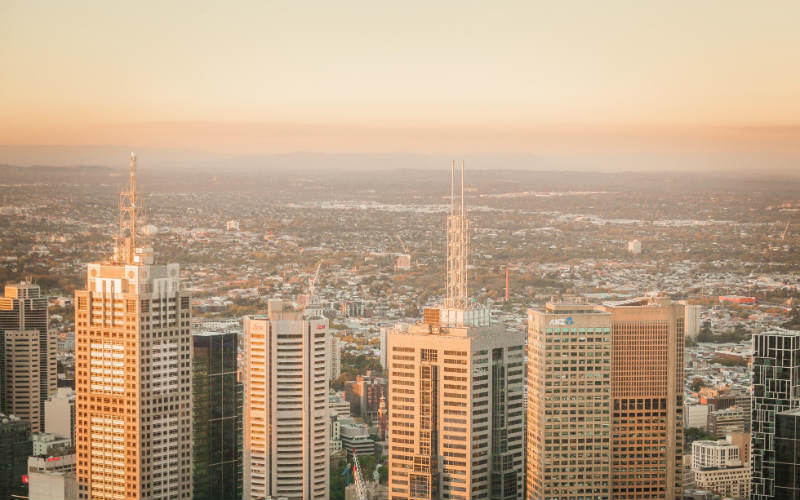
Sydney and Melbourne continue to be the driving force in the housing market turnaround, with values up 2.7% and 2.2% respectively over the month.
All other capitals excluding Darwin saw an increase in values, demonstrating the country-wide improvement.
Since finding its trough in June of this year, the national dwelling value index has recovered by 4.7%, however, values remain 4.1% below their 2017 peak.
CoreLogic Head of Research Tim Lawless said there were a variety of factors supporting the strong gains in house prices.
“The synergy of a 75 basis points rate cut from the Reserve Bank, a loosening in loan serviceability policy from APRA, and the removal of uncertainty around taxation reform following the federal election outcome, are central to this recovery,” Mr Lawless said.
“Additionally, we’re seeing advertised stock levels persistently low, creating a sense of urgency in the market as buyer demand picks up.
“There’s also the prospect that interest rates are likely to fall further over the coming months and an improvement in housing affordability following the recent downturn are other factors supporting a lift in values.”
The results come after the busiest auction week of the year, with over 3,000 homes taken to auction across the capital cities.
Of the 3,058 homes auctioned, according to preliminary figures, 78.9% returned a successful result, coming in higher than last week’s final clearance rate of 68.5% across a lower 2,612 auctions and significantly higher than final results from one year ago (41.3% clearance rate from 2,749 auctions).
Change in dwelling values as of November 2019
| Monthly change | Quarter change | Annual change | Median value | |
| Sydney | 2.7% | 6.2% | 1.6% | $840,072 |
| Melbourne | 2.2% | 6.4% | 2.2% | $666,883 |
| Brisbane | 0.8% | 1.8% | -0.5% | $497,491 |
| Adelaide | 0.5% | 0.9% | -0.5% | $433,845 |
| Perth | 0.4% | -0.9% | -7.7% | $437,080 |
| Hobart | 2.3% | 2.8% | 4.2% | $474,186 |
| Darwin | -1.2% | -1.1% | -10.9% | $388,018 |
| Canberra | 1.6% | 3.2% | 3.0% | $611,841 |
| Combined capitals | 2.0% | 4.6% | 0.4% | $622,346 |
| National | 1.7% | 3.8% | 0.1% | $537,506 |
Source: CoreLogic
Will this growth continue in 2020?
After five months of an unexpected period of rapid recovery, Mr Lawless questioned how long this can be sustained.
“Considering wages and household income growth remains low, economic conditions are losing momentum and housing affordability is once again worsening (from an already high base in the largest cities), there are likely to be some headwinds in maintaining such a fast recovery.
“Additionally, the market is yet to be tested on higher supply levels.
“With selling conditions looking very strong, there is a high probability that listing numbers will show a material lift through the first quarter of 2020 which will test the depth of the market, and likely ease some of the urgency that is contributing to higher prices.”
Mr Lawless added that with interest rates likely to fall further in 2020, additional stimulus could counteract some of these headwinds.
“Mortgage rates are already at their lowest level since at least the 1950s which is one of main factors supporting increasing market activity.
“If rates do move lower, no doubt policymakers will be watchful for any triggers that could provoke a policy response limiting housing credit.
“Previous rounds of macro-prudential have had an immediate slowing effect on market activity.”

Ready, Set, Buy!
Learn everything you need to know about buying property – from choosing the right property and home loan, to the purchasing process, tips to save money and more!
With bonus Q&A sheet and Crossword!
