That's according to Domain's latest Auction Report for May 2021, which found that Sydney, Melbourne and Adelaide saw the largest number of auctions scheduled in a single month since Domain first started keeping records.
Those records extend back to 1995 in NSW, 1997 in Victoria, and 2002 in South Australia.
Clearance rates - the percentage of successful auctions - also hit a new record of 90% in Canberra, and Brisbane's clearance rate of 67.2% is still the third highest ever recorded there.
Sydney saw 3,956 properties sold at auction; Melbourne more than 4,000; Brisbane 362; and Adelaide and Canberra recorded 462 and 327 sold properties.
| City | Clearance Rate | Auctions Scheduled | Auction Sold | Passed In | Sold Prior | Withdrawn |
| Sydney | 77.3% | 5486 | 3956 | 485 | 34.5% | 13.2% |
| Melbourne | 72.2% | 6112 | 4040 | 856 | 23.4% | 12.6% |
| Brisbane | 67.2% | 688 | 362 | 134 | 27.1% | 8% |
| Adelaide | 76.2% | 723 | 462 | 100 | 23.6% | 7.3% |
| Canberra | 89.8% | 400 | 327 | 25 | 22.8% | 3.3% |
|
Source: Domain. Geographies are based on ABS GCCSA geography. Auction reporting rates are above 91% across all capitals apart from Brisbane at 78% and Adelaide at 83%. |
||||||
Auctions typically represent around 10% of all property sales in Australia, and they have been red hot lately.
In April, research by property AI firm Archistar already showed 2021 is seeing record numbers of auctions, and prices too were also starting to hit records.
Dr Andrew Wilson, chief economist at Archistar, said in March it was "unlikely we had yet reached the peak of auction prices".
“Auction clearance rates have climbed to unprecedented levels over [March 2021] in most capitals reflecting unprecedented buyer competition for available property," he said.
“Clearance rates are likely to remain high with the market constraints of recent years now released and surging buyer demand seemingly yet to be satisfied."
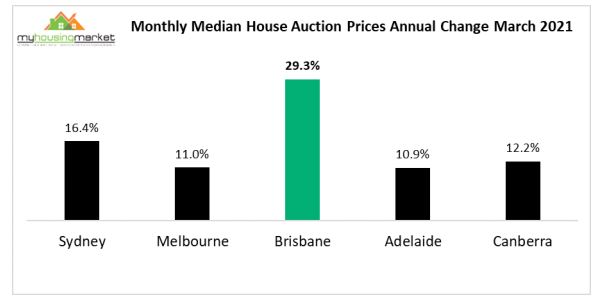
Source: Archistar
See also: House price boom continues as values rise 2.2% in May
In its Auction Preview for this Saturday (5 June), Domain said this weekend will be the busiest for auctions since then.
"There are 2,616 scheduled auctions across Sydney, Melbourne, Brisbane, Adelaide and Canberra this Saturday, making it the second busiest auction weekend of the year," Domain's Dr Nicola Powell and Dr Henry Yu said.
"Auction volumes have been steadily rising, with 6.1% more auctions compared to last Saturday. Of the scheduled auctions, 39% are in Sydney and 50% are in Melbourne.
"Despite a slight easing of restrictions, onsite auctions are still deemed non-essential by the Victorian government. Virtual auctions continue to act as the only alternative available for the auctions to take place this coming Saturday."
Buying a home or looking to refinance? The table below features home loans with some of the lowest interest rates on the market for owner occupiers.
| Lender | Home Loan | Interest Rate | Comparison Rate* | Monthly Repayment | Repayment type | Rate Type | Offset | Redraw | Ongoing Fees | Upfront Fees | Max LVR | Lump Sum Repayment | Extra Repayments | Split Loan Option | Tags | Features | Link | Compare | Promoted Product | Disclosure |
|---|---|---|---|---|---|---|---|---|---|---|---|---|---|---|---|---|---|---|---|---|
5.54% p.a. | 5.58% p.a. | $2,852 | Principal & Interest | Variable | $0 | $530 | 90% |
| Promoted | Disclosure | ||||||||||
5.49% p.a. | 5.40% p.a. | $2,836 | Principal & Interest | Variable | $0 | $0 | 80% |
| Promoted | Disclosure | ||||||||||
5.64% p.a. | 5.89% p.a. | $2,883 | Principal & Interest | Variable | $250 | $250 | 60% |
| Promoted | Disclosure | ||||||||||
5.64% p.a. | 5.89% p.a. | $2,883 | Principal & Interest | Variable | $248 | $350 | 60% |
| Disclosure |


")

Houses continue to outperform units
Houses are still the key driver behind recent auction success in terms of both clearance rates and prices.
According to Domain, house clearance rates outperformed units in every capital city, although unit clearance rates are still strong.
In Sydney for example, house and unit clearance rates in May were 78.2% and 75% respectively.
According to Dr Powell, the difference between house and unit clearance rates does appear to be narrowing.
"The house-unit clearance rate difference grew from around 3% in mid-2020, peaked at 12.7% in November 2020 and has gradually returned back to around 3% in May," she said.
"The reduced difference is likely to be associated with increased investor and first-home-buyer participation, or overall affordability bottlenecks associated with trying to purchase a house in Sydney.
"For houses and units, this month’s clearance rate is the strongest May result in six years."
Auction results May - houses
Photo by Thomas Chan on Unsplash

Ready, Set, Buy!
Learn everything you need to know about buying property – from choosing the right property and home loan, to the purchasing process, tips to save money and more!
With bonus Q&A sheet and Crossword!


 Bea Garcia
 Denise Raward
 Harry O'Sullivan
 Emma Duffy