
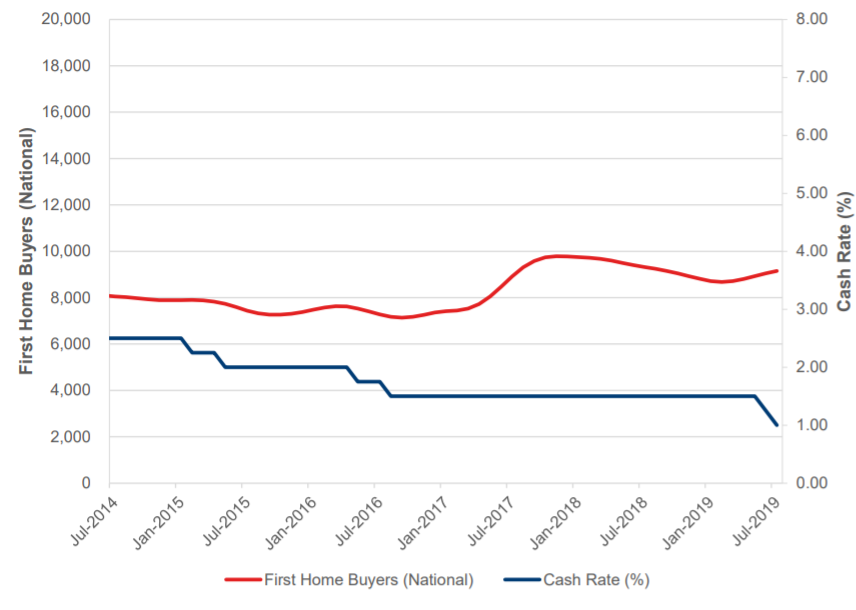
Analysis of Australian Bureau of Statistics (ABS) and Reserve Bank (RBA) data from PRD Nationwide shows recent first home buyer (FHB) activity has historically been somewhat independent of recent cash rate movements, although there has been a slight uptick in recent approved loans to first-time buyers.
Previous cash rate movements in 2015 and 2016 actually saw first home buyer numbers go backwards, while FHB activity fluctuated between July 2016 and May 2019 when the cash rate was held at 1.50%.
This, according to PRD’s research, was due to factors such as:
- Income tax policy
- Political uncertainty
- The tightening of lending policies
| Period | Cash rate | First Home Buyers | Change in FHBs (vs previous month) |
|---|---|---|---|
| Feb-15 | 2.25% | 7,899 | 0.0% |
| May-15 | 2.00% | 7,735 | -1.2% |
| May-16 | 1.75% | 7,534 | -1.1% |
| Aug-16 | 1.50% | 7,173 | -1.4% |
| Jun-19 | 1.25% | 9,054 | 1.4% |
| Jul-19 | 1.00% | 9,149 | 1.0% |
Source: Australian Bureau of Statistics, Reserve Bank of Australia. Prepared by PRDnationwide Research.
As the data shows, the number of loans to FHBs increased by 1.4% from May to June and a further 1.0% from June to July, when there were two consecutive 25 basis point cuts to the cash rate.
In previous instances where the cash rate was lowered there were actually sizeable falls in the number of FHBs compared to previous months.
For example, the most significant decline in first-home buyers in line with a rate cut was in August 2016, when activity recorded a monthly decline of 1.4%.
The RBA slashed the rate to 1.5% that month, and this was the last time the cash rate was changed until June this year.
“Overall, a further cash rate cut does not guarantee more FHB activity, as it is not the only factor in FHB’s decision making,” the report said.
The most recent RBA data for August (released in October) shows a major increase in the number of first home buyers, with the number of lending commitments to owner-occupier first home buyers rising 5.2% month-on-month.
This means the FHB market share is now just over 30% of the housing market – a near eight-year high.
“First home buyers now account for 30.1% of the total market, the highest share since the start of 2012, so continued growth in this segment is important for the broader housing market,” HIA Economist Tom Devitt said following the ABS’s release.
“Given the lag between loan applications and final approval, it is likely that the full effects of recent stimulus is yet to play out in the data and will provide further support to the market as the year progresses.”
Read more: Which lenders have cut rates in October?
First Home Loan Deposit Scheme gets the green light
The First Home Loan Deposit Scheme was passed through both the house of representatives and the senate this week and will kick off on January 1 2020.
The scheme, which will provide a guarantee to eligible first home buyers to purchase a home with a deposit as low as 5%, will support 10,000 first home buyers each year.
Treasurer Josh Frydenberg and Minister for Housing and Assistant Treasurer Michael Sukkar said the passage of the scheme will “facilitate earlier access to home ownership for first home buyers”.
“The Government recognises that saving a deposit has become a more significant barrier to entering the housing market. It can take ten years for the average first home buyer to save a 20% deposit.”
Not everyone approves of this scheme however, with some questioning its effectiveness.
Grattan Institute’s household finances program director Brendan Coates said the scheme is too small to make much of a difference to homeownership rates for first home buyers.
“Because the Scheme is small – the Government intends to offer just 10,000 guarantees a year – it is unlikely to make much of a difference to homeownership rates for young Australians, or house prices,” Mr Coates said.
“It would push up prices, benefitting sellers at the expense of first home buyers, while increasing the risks of inappropriate lending at costs to both households and government.
“Because it costs the budget less, this latest Scheme is less bad than its predecessors. But it shares their critical flaw: it pretends we can make housing more affordable without hurting anyone.”
Investment lending soars
The value of home loans taken out by investors has increased 11.6% in the three months ending August 2019, according to data from CoreLogic.
This is the fastest rate of growth in investment lending since November 2016, although investor activity still remains 43% below its mid-2015 peak.
CoreLogic head of research Tim Lawless said investors have been buoyed by the recent uptick in house prices and the removal of regulatory caps on investment credit.
“More recently, housing market conditions have turned a corner, with values rising across five of the eight capital cities over the September quarter and three of the broad ‘rest of state’ region,” Mr Lawless said.
“Looking forward, there is a strong likelihood that investor activity will increase further.
“The long-term average shows investors are typically around one-third of mortgage demand, implying investors are currently under-represented in the market.
“As investment activity rises, we could see increased price pressures as this sector of the market tends to be more competitive in setting new price benchmarks.”

Ready, Set, Buy!
Learn everything you need to know about buying property – from choosing the right property and home loan, to the purchasing process, tips to save money and more!
With bonus Q&A sheet and Crossword!


 Bernadette Lunas
 Denise Raward
 Harry O'Sullivan
 Alex Brewster
 Brooke Cooper