It's the second consecutive monthly rise in house prices, following a 2.1% drop in values between April and September, with every capital city seeing an increase.
Buying a home or looking to refinance? The table below features home loans with some of the lowest variable interest rates on the market for owner occupiers.
| Lender | Home Loan | Interest Rate | Comparison Rate* | Monthly Repayment | Repayment type | Rate Type | Offset | Redraw | Ongoing Fees | Upfront Fees | Max LVR | Lump Sum Repayment | Extra Repayments | Split Loan Option | Tags | Features | Link | Compare | Promoted Product | Disclosure |
|---|---|---|---|---|---|---|---|---|---|---|---|---|---|---|---|---|---|---|---|---|
5.54% p.a. | 5.58% p.a. | $2,852 | Principal & Interest | Variable | $0 | $530 | 90% |
| Promoted | Disclosure | ||||||||||
5.49% p.a. | 5.40% p.a. | $2,836 | Principal & Interest | Variable | $0 | $0 | 80% |
| Promoted | Disclosure | ||||||||||
5.64% p.a. | 5.89% p.a. | $2,883 | Principal & Interest | Variable | $250 | $250 | 60% |
| Promoted | Disclosure | ||||||||||
5.64% p.a. | 5.89% p.a. | $2,883 | Principal & Interest | Variable | $248 | $350 | 60% |
| Disclosure |


")

CoreLogic’s Head of Research Tim Lawless said if the current trend persists, house prices will surpass pre-COVID levels early next year.
"The national home value index is still seven tenths of a percent below the level recorded in March, but if housing values continue to rise at the current pace we could see a recovery from the COVID downturn as early as January or February next year," Mr Lawless said.
"The recovery in Melbourne, where home values remain 5% below their recent peak, will take longer."
The rapid recovery in house prices is a far cry from what economists predicted at the height of the pandemic, with some forecasting falls of more than 30%.
Despite the recovery, Sydney and Melbourne home values remain at similar levels seen in early 2017.
Brisbane, Adelaide, Hobart, and Canberra saw housing values move to record highs through November.
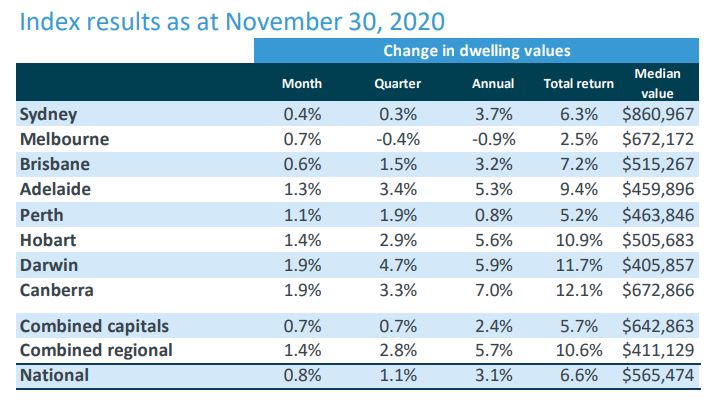
Source: CoreLogic
House and unit value performance continued to diverge in November, with house values rising 1.1% in the last three months, driving the recovery in capital cities, while unit values fell 0.6% in the same period.
“This trend towards stronger conditions in detached housing markets is evident across most of the capital cities,” Mr Lawless said.
"Relative weakness in the unit market can be attributed to factors including low investment activity, higher supply levels in some regions, and weaker rental market conditions across key inner-city unit precincts."
But Mr Lawless added Melbourne's unit market was the surprising exception, recording a smaller than expected decline and a more substantial recovery in recent months.
"We suspect the stronger trend in Melbourne unit values relative to houses could be short-lived unless overseas migration turns around sooner than expected which would help to shore up rental tenancy demand," he said.
Regional areas continued to outperform the capitals in November, with regional home values up 1.4% compared to 0.7% in the cities.
NAB: Sentiment shifting rapidly, 5% yearly growth expected
One NAB spokesperson said housing market sentiment has shifted rapidly, with Executive Home Ownership Andy Kerr saying demand for NAB home loans is stronger than it's been for more than two years.
"Applications over the past six weeks are up more than 25 per cent against the prior six weeks," Mr Kerr said.
"Demand has been supported by record low rates, growing confidence in the economic recovery and strong government support measures."
Mr Kerr also said NAB is forecasting a 5% property price growth in each of the next two years in spite of lagging apartment growth, a similar projection to ANZ's 9%.
“We expect strong interest to continue given the likelihood of low rates for several years and as more stimulus measures come into effect from state governments," he said.
“While risks remain due to the ongoing employment impacts of COVID-19 and a likely slowdown in population growth, today’s data show house prices already have stabilised and at NAB we’re seeing rising interest in regional areas in particular.”
Improvement seen across the board
The rise in house prices coincides with a range of other indicators pointing to further improvement in the property market.
It's a sellers market, with the number of properties advertised for sale remaining 20% lower than this time last year and 24% below the five year average.
The spring period saw a 42% rise in the number of new listings added to the market nationally, while the total number of listings held firm.
CoreLogic said this reflected a strong rate of absorption as prospective buyers continued to outnumber newly advertised supply additions.
Nationally, CoreLogic’s settled sales estimates over the past three months were about 1% higher than the same period last year, partially driven by strong regional buyer activity.
Auction markets continued to strengthen, with November clearance rates holding above 70%, well above the decade average of 61%.
The number of auctions is expected to lift in the first two weeks of December, providing a timely test of market depth.
“Low advertised stock levels, together with a rising number of active buyers, is creating a renewed sense of urgency in the market," Mr Lawless said.
"Buyer demand is mostly being fueled by a surge in owner occupiers rather than investors, looking to take advantage of historically low interest rates, generous government incentives and an increased state of normality.”
Rental conditions continue to diverge
Capital city house rents were 0.7% higher in November while unit rents were down -0.6%, with CoreLogic data showing a well established trend of house rents performing better than unit rents since COVID began.
Across the combined capitals, unit rents have fallen by -5.4% since March while house rents have increased by 1.1%.
Most of the weakness in rental market conditions is emanating from Melbourne and Sydney where unit rents are -6.6% and -7.6% lower respectively since March.
CoreLogic said rental markets were likely to firm as labour markets tightened and state borders reopened, but a recovery in the Sydney and Melbourne markets would be dependent upon international borders reopening.
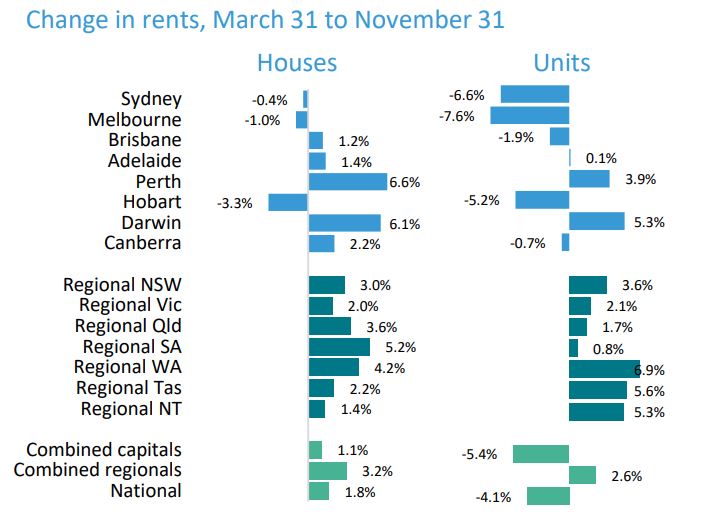
Source: CoreLogic
Photo by Road Trip with Raj on Unsplash

Ready, Set, Buy!
Learn everything you need to know about buying property – from choosing the right property and home loan, to the purchasing process, tips to save money and more!
With bonus Q&A sheet and Crossword!


 Denise Raward
 Harry O'Sullivan

 Alex Brewster
 Rachel Horan