
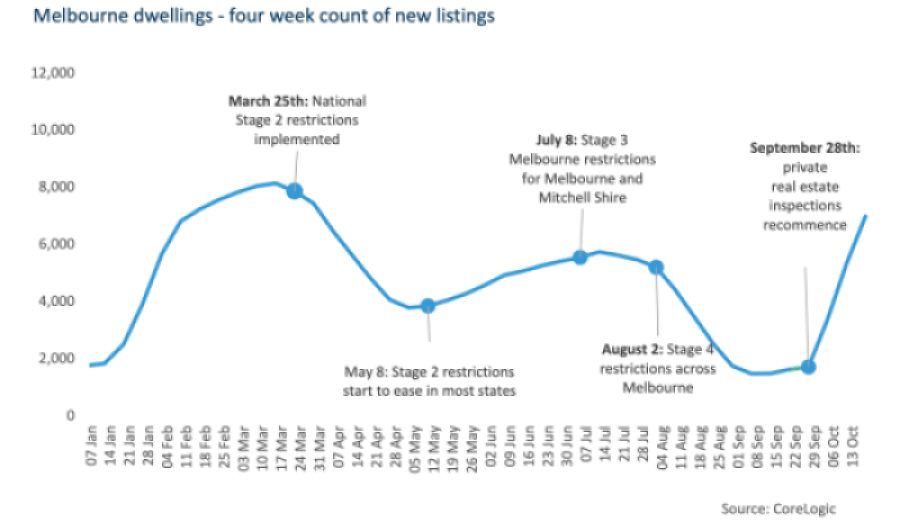
After Premier Daniel Andrews' announcement on September 28 that private real estate inspections would be allowed, property listings skyrocketed almost instantly.
CoreLogic data shows the number of new property listings added to the market for sale increased by 330% in the four weeks ending 18th October.
This represents an increase in new listings from 1,606 in the four weeks to September 20th to nearly 7,000 over the period to October 18th.
Buying a home or looking to refinance? The table below features home loans with some of the lowest variable interest rates on the market for owner occupiers.
| Lender | Home Loan | Interest Rate | Comparison Rate* | Monthly Repayment | Repayment type | Rate Type | Offset | Redraw | Ongoing Fees | Upfront Fees | Max LVR | Lump Sum Repayment | Extra Repayments | Split Loan Option | Tags | Features | Link | Compare | Promoted Product | Disclosure |
|---|---|---|---|---|---|---|---|---|---|---|---|---|---|---|---|---|---|---|---|---|
5.54% p.a. | 5.58% p.a. | $2,852 | Principal & Interest | Variable | $0 | $530 | 90% |
| Promoted | Disclosure | ||||||||||
5.49% p.a. | 5.40% p.a. | $2,836 | Principal & Interest | Variable | $0 | $0 | 80% |
| Promoted | Disclosure | ||||||||||
5.64% p.a. | 5.89% p.a. | $2,883 | Principal & Interest | Variable | $250 | $250 | 60% |
| Promoted | Disclosure | ||||||||||
5.64% p.a. | 5.89% p.a. | $2,883 | Principal & Interest | Variable | $248 | $350 | 60% |
| Disclosure |


")

CoreLogic Head of Research Eliza Owen said listing numbers have been extremely responsive to changes in social distancing policies.
"After months of restrictions, pent-up demand from sellers has accumulated so much, that more stock was recently added for sale in Melbourne than any other capital city region," Ms Owen said.
Source: CoreLogic
Ms Owen said it's possible part of the surge in new property listings could be a sign of distressed sales.
"A significant increase in new stock across Melbourne can mean different things for the state of the market. ‘Forced’ selling was a possibility from the pandemic, as significant job losses across Victoria may have limited the ability of some households to keep paying their mortgage," Ms Owen said.
"The latest financial stability review from the RBA noted that October was the period most mortgage deferrals were set to expire, which may have contributed to an increase in new listings in recent weeks. However, CoreLogic data does not point to a significant increase in mortgagee in possession events across Victoria."
Data from the Australian Banking Association (ABA) shows repayments have resumed on almost half (45%) of all deferred mortgages.
But recent data from Commonwealth Bank showed 14% of deferred home loans had at least one borrower still receiving JobSeeker payments, which could mean borrowers may struggle to meet their repayments beyond the four-month mortgage deferral extension.
Rising listings sign of market rebound
Ms Owen said the large increase in property listings could also point to a market rebound as vendors sell to meet rising demand.
"High buyer demand can also mitigate risk for distressed sales, because the added demand pushes up prices," Ms Owen said.
"One way to assess the state of the market through listings data is to observe how total listing volumes are tracking against new listings. New listings rose faster than total listings across Melbourne in the four weeks ending 18th of October.
"New stock added to market increased by around 5,370 properties, but the change in total stock was only 4,790. This suggests at least some stock on market has been absorbed over the past four weeks."
Other indicators could signal an improvement in property market conditions. In the week ending 18th of October, the final auction clearance rate was 60.2% in Melbourne, which Ms Owen said was achieved alongside the highest volume of auctions seen in two months.
"Over the past month, the rate of decline across Melbourne dwelling values has also eased. It is clear that even after long, strict restrictions, vendors are keen to sell," Ms Owen said.
"However, due to the lag between an initial property listing and a sale, it will be a few weeks before we can understand how strong buyer appetite is."

Ready, Set, Buy!
Learn everything you need to know about buying property – from choosing the right property and home loan, to the purchasing process, tips to save money and more!
With bonus Q&A sheet and Crossword!


 Harrison Astbury
 Harry O'Sullivan