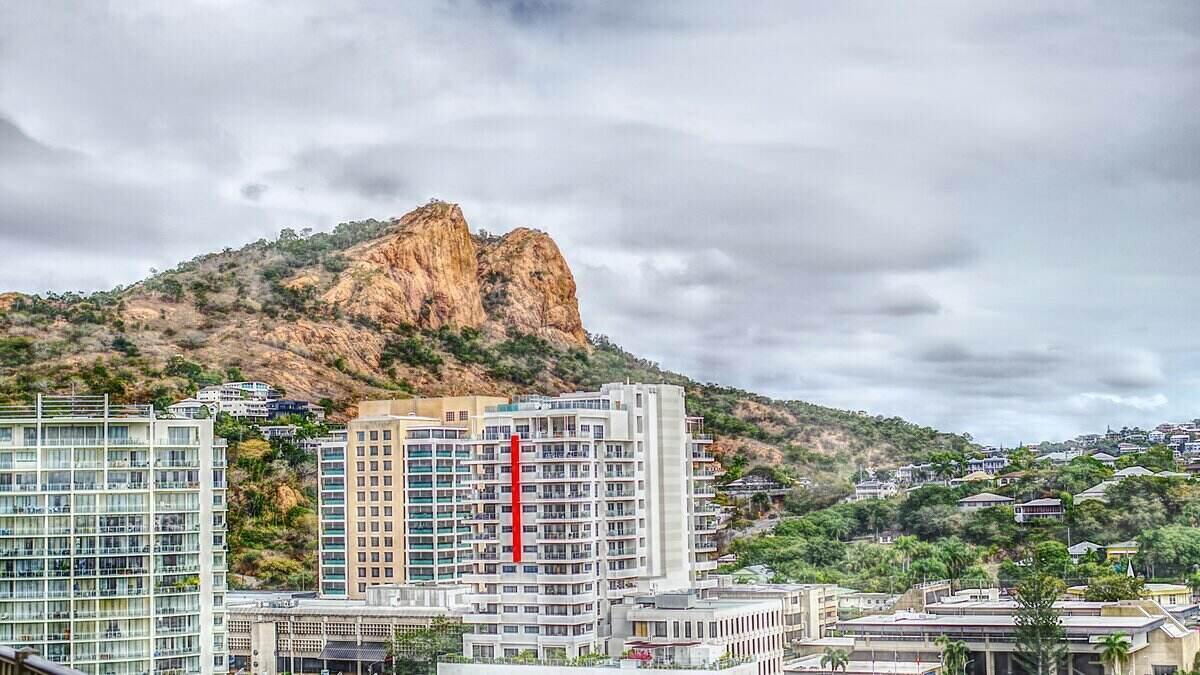
The Real Estate Institute of Australia's (REIA) quarterly housing affordability report shows there are 105% more first home buyers in Western Australia compared to a year ago.
Affordability has worsened Australia-wide over the March quarter however, with the proportion of income required to meet loan repayments increasing to 34.7%, up 10 basis points (0.1%).
Loan sizes keep growing too, according to REIA President Adrian Kelly.
"Over the March quarter, the average loan size to first home buyers increased to $425,875, an increase of 2.2% over the quarter and an increase of 1.2% over the past 12 months," he said.
This is compared to a market-wide average loan size of $506,340, an increase of 1% over the quarter and up 2.6% on a year ago.
Tasmania led the charge in loan size growth, up 10.8% over 12 months.
The release of REIA's report comes after CoreLogic revealed on Tuesday that home prices were up Australia-wide by 2.2% in May.
Though compared to a year ago, affordability has improved 50 basis points (0.5%), according to REIA's report.
Buying a home or looking to refinance? The table below features home loans with some of the lowest interest rates on the market for owner occupiers.
| Lender | Home Loan | Interest Rate | Comparison Rate* | Monthly Repayment | Repayment type | Rate Type | Offset | Redraw | Ongoing Fees | Upfront Fees | Max LVR | Lump Sum Repayment | Extra Repayments | Split Loan Option | Tags | Features | Link | Compare | Promoted Product | Disclosure |
|---|---|---|---|---|---|---|---|---|---|---|---|---|---|---|---|---|---|---|---|---|
5.54% p.a. | 5.58% p.a. | $2,852 | Principal & Interest | Variable | $0 | $530 | 90% |
| Promoted | Disclosure | ||||||||||
5.49% p.a. | 5.40% p.a. | $2,836 | Principal & Interest | Variable | $0 | $0 | 80% |
| Promoted | Disclosure | ||||||||||
5.64% p.a. | 5.89% p.a. | $2,883 | Principal & Interest | Variable | $250 | $250 | 60% |
| Promoted | Disclosure | ||||||||||
5.64% p.a. | 5.89% p.a. | $2,883 | Principal & Interest | Variable | $248 | $350 | 60% |
| Disclosure |


")

Vacancy rates and rental affordability down
REIA's report also shows that rental affordability declined across the country, with the proportion of income required to meet median rents increasing to 24.4%.
This is an increase of 0.4% over the March quarter, and an increase of 0.7% over the past 12 months.
Domain figures released today also show the vacancy rate has declined for the second month in a row to 1.7% nationwide.
This figure was buoyed by a return to pre-pandemic vacancy levels in Sydney, down to 2.7%, with a 5% drop in rental listings over May.
Vacancy rates in Darwin, Adelaide, and Brisbane are at their lowest point since Domain's records began in 2017.
In Melbourne, rental vacancies remain high at 4.2%, adding to fears about the city's 'fragile' property market.
Domain's vacancy rate report authors Henry Yu and Dr Nicola Powell said the overall rental market tightening "will be a welcome boost for landlords".
"The worst is now behind us... for the second month in a row, Melbourne’s vacancy rate tightened more than any other capital, declining from 4.2% to 3.8%," they said.
"Vacancy rates continue to remain tight in the smaller capital city rental markets, and this is likely to continue to put increased pressure on asking rents."
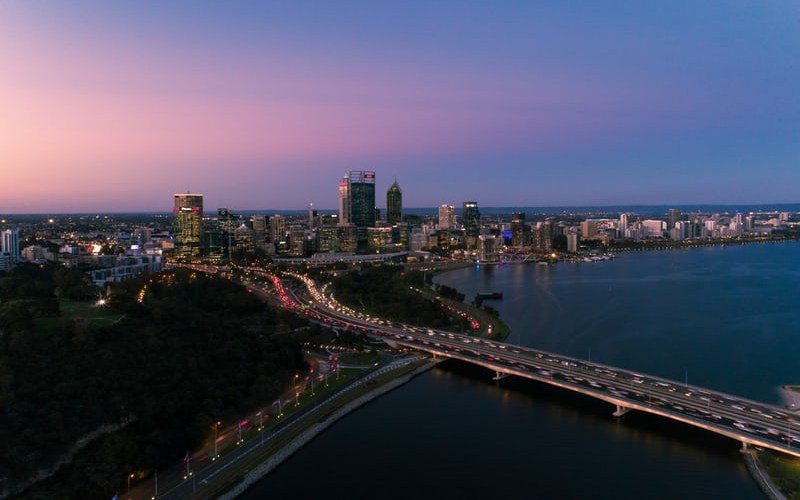
Photo by Nathan Hurst on Unsplash

Ready, Set, Buy!
Learn everything you need to know about buying property – from choosing the right property and home loan, to the purchasing process, tips to save money and more!
With bonus Q&A sheet and Crossword!
.jpg)

 Bea Garcia
 Denise Raward
 Harry O'Sullivan
 William Jolly