Buyer's agency Propertyology's 'Decade in Review (2010-2019) Report' analysed the period which commenced in the shadow of the Global Financial crisis (GFC) and ended in the ashes of the summer of bushfires and the dawn of COVID-19.
With a GFC hangover, Australian property markets were largely unspectacular in the first half of the 2010s, outside of Sydney.
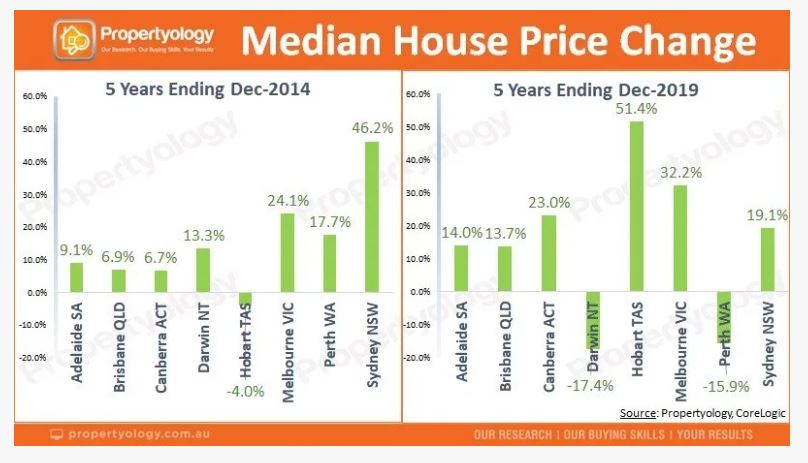
Initially driven by a big influx in international investors followed by a lift in service sector jobs, Sydney's 46% median house price increase was the best of the capital cities over the five years ending 2014.
Buying a home or looking to refinance? The table below features home loans with some of the lowest variable interest rates on the market for owner occupiers.
| Lender | Home Loan | Interest Rate | Comparison Rate* | Monthly Repayment | Repayment type | Rate Type | Offset | Redraw | Ongoing Fees | Upfront Fees | Max LVR | Lump Sum Repayment | Extra Repayments | Split Loan Option | Tags | Features | Link | Compare | Promoted Product | Disclosure |
|---|---|---|---|---|---|---|---|---|---|---|---|---|---|---|---|---|---|---|---|---|
5.54% p.a. | 5.58% p.a. | $2,852 | Principal & Interest | Variable | $0 | $530 | 90% |
| Promoted | Disclosure | ||||||||||
5.49% p.a. | 5.40% p.a. | $2,836 | Principal & Interest | Variable | $0 | $0 | 80% |
| Promoted | Disclosure | ||||||||||
5.64% p.a. | 5.89% p.a. | $2,883 | Principal & Interest | Variable | $250 | $250 | 60% |
| Promoted | Disclosure | ||||||||||
5.64% p.a. | 5.89% p.a. | $2,883 | Principal & Interest | Variable | $248 | $350 | 60% |
| Disclosure |


")

A 35% increase in the median house price in Goulburn, Newcastle, Bendigo and Wingecarribee was more than double the rate of growth in six out of eight capitals.
Wollongong, Kiama, Geelong, Lake Macquarie, Bathurst, Dubbo, Baw Baw and Shellharbour also outperformed seven of the eight capitals over the five-years ending 2014.
Propertyology Head of Research Simon Pressley said the second half of the decade exposed flaws in some states' property markets, while others thrived.
"The second half of the decade exposed Perth and Darwin’s unhealthy reliance on mining, leading to a very weak property market," Mr Pressley said.
"Hobart was the clear capital city standout with a 51% increase in median house price along with a 39% increase in rents."
Shifted dwelling supply demand
According to Propertyology and CoreLogic data, the volume of residential dwellings in Australia increased from 8.8 million to 10.4 million over the decade.
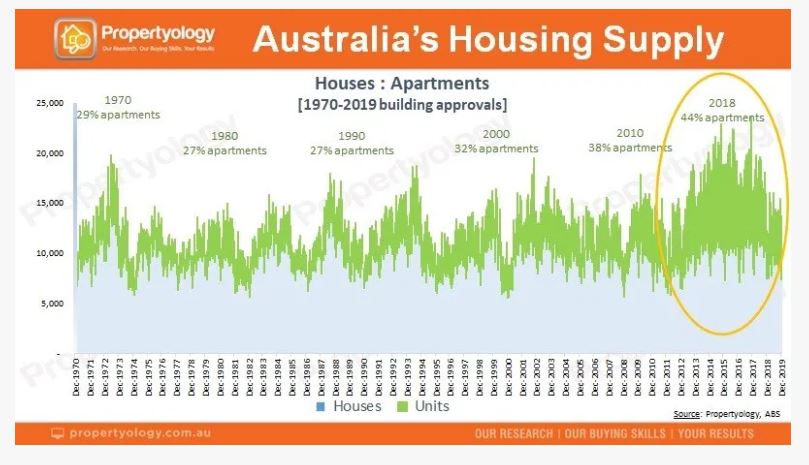
Mr Pressley said one of several big shifts in Australian real estate over the decade was increased dwelling density.
"43.7% of all residential dwellings approved in Australia over the 10-years ending 2019 were attached dwellings (apartments and townhouses), which was a significant increase on the 31% in the previous decade," he said.
"Five out of eight capital cities had more apartments than houses approved during the decade - Canberra (70.9%), Sydney (65.9%, Melbourne (52%), Darwin (51%), and Brisbane (50%)."
While there was no shortage of apartment buyers, a strong supply-side response, concerns with construction integrity and same-same Lego building design resulted in vastly inferior financial performance of apartments compared to houses.
“Australia changed during the second half of the twenty-tens," Mr Pressley said.
"While housing affordability constraints and over-supply were creating challenges for big city property markets, there was a growing appetite for less stressful lifestyles and detached houses that people could still afford to buy.”
Accordingly, Australia’s best performed property markets over the five-years ending December 2019 included Victoria’s Macedon Ranges, Mitchell, and Bass Coast, Noosa in Queensland, New South Wales’ Snowy Monaro, Shoalhaven, Orange, Bega Valley and Nambucca, while the property market in Launceston was also strong.
Housing finance strangled
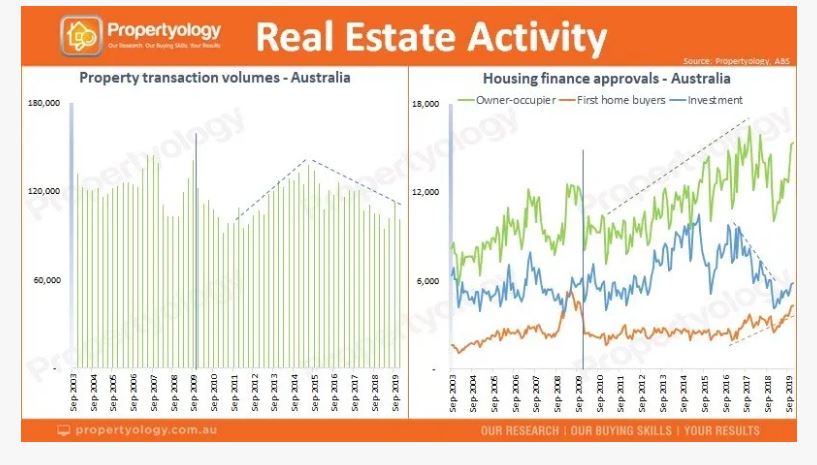
Despite an almost 4 million person growth in population, record low interest rates and millions of extra dwellings, Propertyology found total transaction volumes were lower than the previous decade.
“The 113,126 quarterly average volume of transactions in Australian real estate during the twenty-tens was notably lower than the 125,342 during the previous decade," Mr Pressley said.
"One would ordinarily expect to see a quarterly average in excess of 140,000 transactions, however a sledgehammer attitude from the banking regulator (APRA) intervened.”
Mr Pressley said the second half of the decade was marred by tight credit supply which slowed the entire economy.
“It had an adverse impact on home ownership, on the bulging $50 billion spent on aged pensions each year, the lost stamp duty revenue diminishing state government infrastructure funding capacity and was a general dampener on the broader economy.”
While the volume of transactions was lower than the previous decade, Mr Pressley said the 2010s saw an increase in professionals assisting and completing these transactions.
“In the real estate sector, this meant that approximately 60% of property transactions were financed via a mortgage broker and there was greater appreciation for engaging a skilled buyer’s agent,” he said.
Higher engagement in financial wellbeing
Mr Pressley said the 2010s would be remembered for the emergence of the rentvestor, with Australians reflecting on financial decisions made by their predecessors and understanding a change in thinking was required.
“The strategy of renting a dwelling that satisfies one’s lifestyle while owning an investment property (or a portfolio of properties) in completely different locations became increasingly common during the decade. We’ll see more of it.” Mr Pressley said.
Another example of Australians becoming more engaged in their future financial wellbeing was evident in the form of enormous growth in self-managed superannuation funds (SMSFs).
The estimated 1.2 million Australians with an SMSF come the end of 2019 was a significant representation from a nation that had a workforce of 13 million people by the end of the decade.

Ready, Set, Buy!
Learn everything you need to know about buying property – from choosing the right property and home loan, to the purchasing process, tips to save money and more!
With bonus Q&A sheet and Crossword!


 Harry O'Sullivan
 Bea Garcia
 Denise Raward