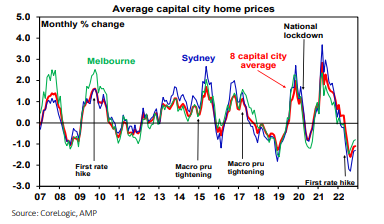
According to CoreLogic, house prices in Australia dropped another 1% in November, marking a 6.9% decline since April.
This is the fastest rate of decline CoreLogic has recorded since 1980 and Shane Oliver, chief economist at AMP, identified several likely causes of the extent of this fall.
“The rapidity of the decline likely reflects the de facto tightening that started with rising fixed mortgage rates a year ago, the speed of RBA cash rate hike - the fastest since 1994- and heightened sensitivity to raised rates due to high debt levels, as well as the extent of the previous boom,” Mr Oliver said.
Capital cities have been the most affected, down 7.5% in the seven month period.
Some cities, including Sydney and Melbourne, have seen the rate of decline begin to slow, but Mr Oliver was not optimistic about whether this indicated things would turn around.
“With the full impact of rate hikes yet to be felt, interest rates still rising and the economy still weakening, the slowdown in price falls in some cities is unlikely to presage an imminent bottoming in home prices," he said.
“Past periods of property price falls experienced a few gyrations in the pace of price declines before prices ultimately bottomed, for example in the 2017-2019 down cycle.”
Mr Oliver went on to predict that prices across Australia would continue to fall well into 2023.
“The full impact of rate hikes is yet to be fully felt, as it takes two-to-three months for RBA hikes to show up in mortgage payments,” he said.
“We are expecting another 0.25% hike this month with the risk of another 0.25% in February and the money market is still expecting the cash rate to be raised to near 4%.”
The cash rate is currently sitting at 2.85%, but most analysts agree with Mr Oliver's prediction that the RBA will announce another increase next week.
Increased interest rates drive down house prices from both the demand and supply side of the equation.
Buyers have a reduced spending capacity with more interest to pay.
According to AMP, the average buyer now can afford to pay $450,000 on a new house, compared to $600,000 in April.
ABS data on lending released Friday shows the average owner occupier home loan has declined nearly 4% from peaks in April.
For those who have already bought, the inevitable rise in mortgage stress as rates surge will potentially see an increase in homeowners forced to sell, causing an oversupply in the housing market, according to Mr Oliver.
AMP’s expectations were for prices to decline 15-20% from the high point in April by September next year.
If the RBA were to bring the cash rate up to the 4% mark though, Mr Oliver said the outlook was even more bleak.
“In this scenario, prices could fall by around 30%,” Mr Oliver wrote.
Advertisement
Buying a home or looking to refinance? The table below features home loans with some of the lowest interest rates on the market for owner occupiers.
| Lender | Home Loan | Interest Rate | Comparison Rate* | Monthly Repayment | Repayment type | Rate Type | Offset | Redraw | Ongoing Fees | Upfront Fees | Max LVR | Lump Sum Repayment | Extra Repayments | Split Loan Option | Tags | Features | Link | Compare | Promoted Product | Disclosure |
|---|---|---|---|---|---|---|---|---|---|---|---|---|---|---|---|---|---|---|---|---|
5.54% p.a. | 5.58% p.a. | $2,852 | Principal & Interest | Variable | $0 | $530 | 90% |
| Promoted | Disclosure | ||||||||||
5.49% p.a. | 5.40% p.a. | $2,836 | Principal & Interest | Variable | $0 | $0 | 80% |
| Promoted | Disclosure | ||||||||||
5.64% p.a. | 5.89% p.a. | $2,883 | Principal & Interest | Variable | $250 | $250 | 60% |
| Promoted | Disclosure | ||||||||||
5.64% p.a. | 5.89% p.a. | $2,883 | Principal & Interest | Variable | $248 | $350 | 60% |
| Disclosure |


")

Picture by Tom Rumble on Unsplash

Ready, Set, Buy!
Learn everything you need to know about buying property – from choosing the right property and home loan, to the purchasing process, tips to save money and more!
With bonus Q&A sheet and Crossword!


 Harry O'Sullivan
 Bea Garcia
 Denise Raward

 Emma Duffy