The year started with a faltering market; house prices tumbled 8.9% between April 2022 and January 2023.
But lo and behold, the dip provided an entry point onto the property market for many buyers, according to CoreLogic head of research Eliza Owen.
“Housing activity rebounded through early 2023 as buyers took advantage of lower prices, however towards the end of 2023 affordability constraints have become more pressing, skewing demand towards the middle-to-lower end of the pricing spectrum,” she said.
“Certainly, lower-priced housing markets such as Perth, Brisbane, and Adelaide saw very resilient conditions through the national downswing period, and strong annual growth through to the end of November.”
CoreLogic also reported a new record for the median dwelling value was reached in mid-November, wiping out all of 2022 and early 2023's losses.
Many of the nation’s top performing suburbs of 2023, when it came to property prices, were located in the smaller capital cities.
Meanwhile, the most expensive property purchase occurred in Sydney, with 24 Victoria Road, Bellevue Hill selling for the highest price of any Aussie property this year.
The cavernous mansion boasts seven bedrooms, five bathrooms, parking for eight cars, an expansive lagoon-style pool, unobstructed harbour views, and a $76 million selling point.
Perhaps unsurprisingly, Bellevue Hill was Australia’s most expensive suburb in 2023, with a median price point of $9.7 million.
But when it comes to house price growth, the most expensive suburbs weren’t necessarily the front runners.
Let’s dive into the top performing areas for both houses and units this year so far, according to the property data business.
Best suburbs for house price growth in 2023
The area that recorded the greatest growth in property prices in 2023 might surprise readers: It was Tralee.
Located on the border of NSW and the ACT, Tralee has seen house values roar 34.2% higher in 2023.
|
Suburb |
Region |
Annual growth |
Median value |
|
Tralee |
Regional NSW |
34.2% |
$782,764 |
|
Brookdale |
Perth |
32.8% |
$474,532 |
|
Armadale |
Perth |
31.4% |
$422,427 |
|
Hilbert |
Perth |
30.1% |
$525,827 |
|
Ravenswood |
Perth |
29.2% |
$630,258 |
|
Whitlam |
ACT |
29.1% |
$1,158,983 |
|
Camillo |
Perth |
27.3% |
$440,749 |
|
Port Vincent |
Regional SA |
25.9% |
$404,359 |
|
Haynes |
Perth |
25.7% |
$494,323 |
|
Bayview |
Sydney |
25.3% |
$3,123,777 |
On the other hand, the majority of the worst performing capital city property markets of 2023 are found in Hobart.
North Hobart, Taroona, and Blackmans Bay has seen house values fall 13.9%, 13.8%, and 9.3% respectively this year.
Meanwhile, house prices in Rochester, Lorne, and Mount Helen – all located in Victoria – have tumbled 26%, 13.9%, and 13% respectively, while those in Mullumbimby, NSW have slumped 15%.
Best suburbs for unit price growth in 2023
When it comes to unit price growth, the nation’s smaller capital cities have led the way, with many Brisbane suburbs entering the top 10.
Taking the top spot is Slacks Creek, located south of the city, near Logan.
Unit prices there have soared 27.4% in 2023.
|
Suburb |
Region |
Annual growth |
Median value |
|
Slacks Creek |
Brisbane |
27.4% |
$341,460 |
|
Beenleigh |
Brisbane |
25.7% |
$336,763 |
|
Girrawheen |
Perth |
25.4% |
$376,868 |
|
Edens Landing |
Brisbane |
25.3% |
$414,288 |
|
Rochedale |
Brisbane |
25.1% |
$480,626 |
|
Andrews Farm |
Adelaide |
22.9% |
$373,379 |
|
Noranda |
Perth |
22.7% |
$381,285 |
|
Maddington |
Perth |
22.4% |
$374,331 |
|
Baldivis |
Perth |
22.3% |
$399,966 |
|
Morley |
Perth |
22.3% |
$483,802 |
But it wasn’t just the capital cities recording notable unit price growth this year.
Those in Emerald, Queensland have seen values soar nearly 21% while prices of units in Mount Gambier, South Australia have leapt 17%.
Many of the worst performing markets for unit values were also in regional Australia, however.
The value of units in Mudgee, NSW have slipped 11% this year and those of units in Torquay, Victoria have dropped around 9%.
Meanwhile, units in West Moonah and New Town (Hobart), The Gardens (Darwin), and Black Rock (Melbourne) have each fallen between approximately 9% and 10% this year.
Houses: Suburbs with the greatest rental price growth in 2023
Unfortunately for renters, the cost of leasing a home rose across the nation in 2023 on the back of soaring demand.
Just 1.04% of rental properties sat vacant in November, Proptrack data reveals.
Though, that's slightly higher than the all-time low recorded in October.
Strong demand and low supply appears to have driven the cost of renting nearly 25% higher in some Aussie suburbs, with Sydney renters seemingly feeling the most pain.
|
Suburb |
Region |
Annual growth |
Median weekly rent |
|
Kensington |
Sydney |
24.9% |
$1,426 |
|
Kew East |
Melbourne |
24.5% |
$977 |
|
Belfield |
Sydney |
23.6% |
$842 |
|
Baynton |
Regional WA |
23.5% |
$1,281 |
|
South Guildford |
Perth |
22.8% |
$697 |
|
Punchbowl |
Sydney |
21.7% |
$774 |
|
Campsie |
Sydney |
21.5% |
$817 |
|
South Coogee |
Sydney |
21.3% |
$1,749 |
|
Armadale |
Perth |
21.1% |
$499 |
|
Bondi Beach |
Sydney |
21.0% |
$1,943 |
Units: Suburbs with the greatest rental price growth in 2023
Sydney also featured heavily in the suburbs that have seen unit rental prices increase the most in 2023.
South western suburb Lakemba took out the crown as the area where rents have grown the fastest, rising 28.1% so far this year.
|
Suburb |
Region |
Annual growth |
Median weekly rent |
|
Lakemba |
Sydney |
28.1% |
$515 |
|
Wiley Park |
Sydney |
28.0% |
$501 |
|
Punchbowl |
Sydney |
24.2% |
$514 |
|
Girrawheen |
Perth |
23.4% |
$517 |
|
Greenacre |
Sydney |
23.0% |
$632 |
|
Campsie |
Sydney |
22.8% |
$559 |
|
Belmore |
Sydney |
22.7% |
$533 |
|
Bankstown |
Sydney |
22.6% |
$565 |
|
Inglewood |
Perth |
22.5% |
$538 |
|
Travancore |
Melbourne |
22.3% |
$517 |
Investors: Australia’s largest rental yields of 2023
Finally, property investors seeking high rental yields might be surprised to learn that many of Australia's regional areas recorded far greater rental income-to-property price ratios than did capital cities in 2023.
Taking out the top spot was Kambalda East, in the Goldfields-Esperance region of Western Australia.
Investment properties there typically boasted a 15.5% rental yield this year.
|
Suburb |
Region |
Rental yield |
Median weekly rent |
|
Kambalda East |
Regional WA |
15.5% |
$360 |
|
Kambalda West |
Regional WA |
13.0% |
$401 |
|
Collinsville |
Regional QLD |
12.8% |
$363 |
|
Newman |
Regional WA |
12.3% |
$684 |
|
South Hedland |
Regional WA |
12.0% |
$912 |
|
Nickol |
Regional WA |
11.4% |
$1,138 |
|
South Boulder |
Regional WA |
11.3% |
$533 |
|
Millars Well |
Regional WA |
10.9% |
$1,005 |
|
Port Hedland |
Regional WA |
10.9% |
$1,328 |
|
Boulder |
Regional WA |
10.7% |
$548 |
What will 2024 bring for Australian property markets?
Domain chief of research and economics Nicola Powell told the Savings Tip Jar Podcast that house prices are expected to rise in the new year, but growth will likely slow.
“What we are forecasting is largely an increase in property prices Australia wide into the regional markets as well as across our major capitals,” Dr Powell said.
“While we are forecasting growth, it's nothing compared to some of the upswings that we have seen unravel in some of our capital cities in previous price cycles.”
Domain expects Sydney property prices to lift 7% to 9% in 2024, those of Brisbane and Adelaide are predicted to rise between 7% and 8%, while Perth property values are expected to increase between 6% and 7%.
“When you look at total supply in the market, compared to Sydney and some of our other capital cities – Brisbane and Perth as examples, and even Adelaide – are still grossly under supplied,” Dr Powell said.
“If I was going to pick out any city where supply levels are much better, that is Melbourne, I think partly because of the ability for Melbourne to sprawl.”
Melbourne property prices are expected to rise between 2% and 4% in the new year.
Meanwhile, 2024 might be an easier year for renters.
The rental market is forecast to reach a “tipping point” next year, Dr Powell noted.
That tipping point is expected to be driven by an increase in household sizes, reduced migration, and an influx of first home buyers entering the property market.
Some of the market's top home loan deals right now
Considering buying a new home in 2024? Check out the interest rates on offer by some of the market's most competitive home loan lenders below.
| Lender | Home Loan | Interest Rate | Comparison Rate* | Monthly Repayment | Repayment type | Rate Type | Offset | Redraw | Ongoing Fees | Upfront Fees | Max LVR | Lump Sum Repayment | Extra Repayments | Split Loan Option | Tags | Features | Link | Compare | Promoted Product | Disclosure |
|---|---|---|---|---|---|---|---|---|---|---|---|---|---|---|---|---|---|---|---|---|
5.54% p.a. | 5.58% p.a. | $2,852 | Principal & Interest | Variable | $0 | $530 | 90% |
| Promoted | Disclosure | ||||||||||
5.49% p.a. | 5.40% p.a. | $2,836 | Principal & Interest | Variable | $0 | $0 | 80% |
| Promoted | Disclosure | ||||||||||
5.64% p.a. | 5.89% p.a. | $2,883 | Principal & Interest | Variable | $250 | $250 | 60% |
| Promoted | Disclosure | ||||||||||
5.64% p.a. | 5.89% p.a. | $2,883 | Principal & Interest | Variable | $248 | $350 | 60% |
| Disclosure |
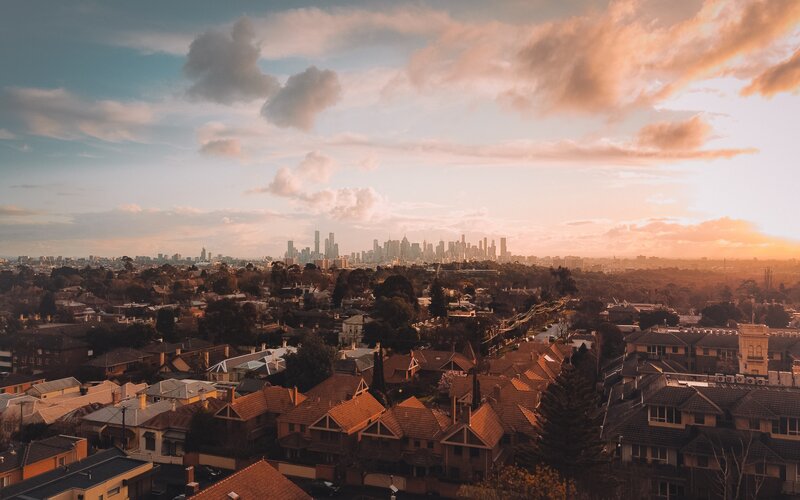
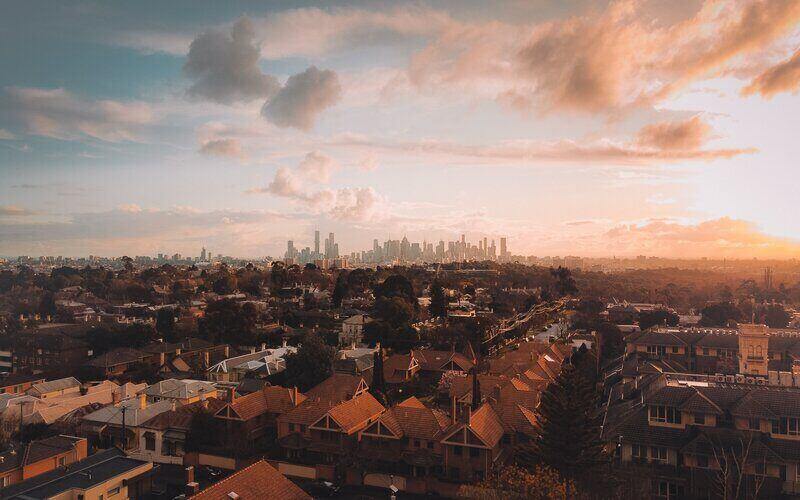
Image by Pat Whelen on Unsplash.

Ready, Set, Buy!
Learn everything you need to know about buying property – from choosing the right property and home loan, to the purchasing process, tips to save money and more!
With bonus Q&A sheet and Crossword!


 Harry O'Sullivan
 Harrison Astbury

