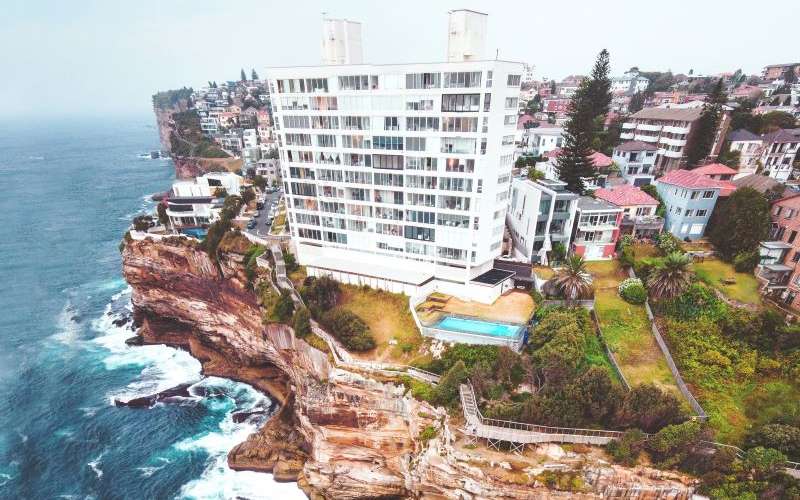
Proptrack has released its list of the suburbs with the highest total sales value last year, with four suburbs recording over $1 billion worth of sales.
Nearly all of these top performing suburbs recorded a lower total compared to 2021, off the back of the significant drop off in Australian property prices over the second half of 2022.
Senior Economist at PropTrack Eleanor Creagh said it was important to note that this data does not exclusively measure how expensive a suburb is.
"The suburbs with the largest total value of sales are typically those that are geographically larger or higher density and higher value suburbs with more properties that transact at higher prices." Ms Creagh told Savings.com.au.
Mosman, NSW
Total sales value: $1,647,710,425
Year on year change: -27%
A harbourside suburb on Sydney's lower north shore, Mosman is home to some of the most expensive real estate in the country, with properties often selling for tens of millions of dollars. The majority of properties in Mosman are grand, multi-storey houses with big gardens, swimming pools, and other luxury features, unsurprising when the median house value for 2022 was $4,775,000 according to realestate.com. Many of these homes are also located on the water's edge, with views of the Harbour and the city.
Brighton, VIC
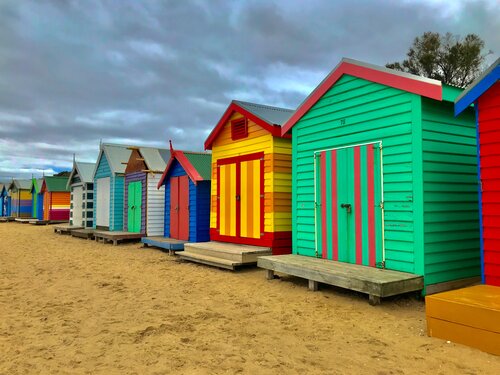
Total sales value: $1,417,688,027
Year on year change: -15%
A beachside suburb only 11kms from the CBD, Brighton was one of two Melbourne suburbs with a sales value exceeding $1 billion. Property in Brighton ranges from classic Victorian homes to modern apartments, with a median house value of $3,225,000 and unit value of $1,175,000.
Kew, VIC
Total sales value: $1,044,394,803
Year on year change: -2%
Notably, Kew was the only one of Australia's billion dollar suburbs not on the oceanside. Kew instead is in the high demand eastern suburbs of Melbourne, notable for tree lined streets and various parks. Kew benefits from many of its homes being heritage properties, the historic and architectural value of which generally means more expensive property.
Surfers Paradise, QLD
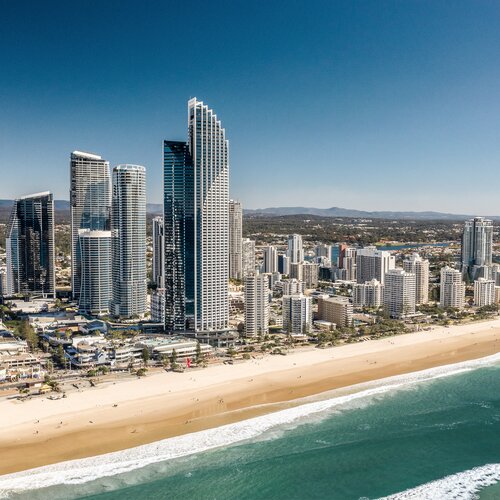
Total sales value: $1,079,162,553
Year on year change: -27%
With iconic beaches and nightlife, Surfers Paradise is the most popular of several Gold Coast areas that dominate the top regional suburbs in terms of total sales value. Surfers incorporates a variety of properties, from luxury apartments to beachside homes, and is particularly notable for its restaurants, bars, and retail.
Top 10 - Metropolitan Areas
|
Suburb |
Collective Sales Value |
Year-on-year change |
|
MOSMAN NSW |
$1,647,710,425 |
-27% |
|
BRIGHTON VIC |
$1,417,688,027 |
-15% |
|
KEW VIC |
$1,044,394,803 |
-2% |
|
GLEN WAVERLEY VIC |
$967,030,589 |
-13% |
|
CASTLE HILL NSW |
$932,117,854 |
-21% |
|
TOORAK VIC |
$891,639,127 |
-21% |
|
MOUNT WAVERLEY VIC |
$882,861,097 |
-11% |
|
ST IVES NSW |
$881,609,356 |
-8% |
|
RANDWICK NSW |
$868,554,008 |
-30% |
|
MANLY NSW |
$841,739,500 |
-27% |
Top 10 - Regional Areas
|
Suburb |
Collective Sales Value |
Year-on-year change |
|
PORT MACQUARIE NSW |
$933,448,331 |
+2% |
|
BUDERIM QLD |
$760,504,914 |
-11% |
|
SOUTHPORT QLD |
$674,891,075 |
-13% |
|
HOPE ISLAND QLD |
$633,729,513 |
-30% |
|
PALM BEACH QLD |
$580,845,774 |
-12% |
|
MAROOCHYDORE QLD |
$579,087,861 |
-7% |
|
ROBINA QLD |
$554,845,716 |
-4% |
|
ORANGE NSW |
$505,498,832 |
-7% |
|
UPPER COOMERA QLD |
$502,260,975 |
+1% |
Other suburbs to watch
This data exclusively captures transactions that took place over the calendar year of 2022.
Ms Creagh highlighted several suburbs comparable in terms of property value to the suburbs on these lists, but without the transaction volume.
"Smaller suburbs like Whale Beach, Palm Beach, Watsons Bay, Tamarama and Point Piper have higher property values than the suburbs that topped the list in terms of the total value of sales, but had relatively fewer properties transacted in the calendar year," she said.
Two suburbs that featured in equivalent lists last year, but saw significant declines in total transaction value that saw them drop off this year were Paddington and Maroubra, both NSW.
Advertisement
Buying a home or looking to refinance? The table below features home loans with some of the lowest interest rates on the market for owner occupiers.
| Lender | Home Loan | Interest Rate | Comparison Rate* | Monthly Repayment | Repayment type | Rate Type | Offset | Redraw | Ongoing Fees | Upfront Fees | Max LVR | Lump Sum Repayment | Extra Repayments | Split Loan Option | Tags | Features | Link | Compare | Promoted Product | Disclosure |
|---|---|---|---|---|---|---|---|---|---|---|---|---|---|---|---|---|---|---|---|---|
5.54% p.a. | 5.58% p.a. | $2,852 | Principal & Interest | Variable | $0 | $530 | 90% |
| Promoted | Disclosure | ||||||||||
5.49% p.a. | 5.40% p.a. | $2,836 | Principal & Interest | Variable | $0 | $0 | 80% |
| Promoted | Disclosure | ||||||||||
5.64% p.a. | 5.89% p.a. | $2,883 | Principal & Interest | Variable | $250 | $250 | 60% |
| Promoted | Disclosure | ||||||||||
5.64% p.a. | 5.89% p.a. | $2,883 | Principal & Interest | Variable | $248 | $350 | 60% |
| Disclosure |
Header image by Jonathon Borba on Pexels, Brighton Beach by Wee Ping Khoo on Unsplash, Surfers Paradise by Carnaby Gilany on Unsplash

Ready, Set, Buy!
Learn everything you need to know about buying property – from choosing the right property and home loan, to the purchasing process, tips to save money and more!
With bonus Q&A sheet and Crossword!
.jpg)


 Harry O'Sullivan
 Harrison Astbury
 Denise Raward