Over the year to November, national housing values fell by 3.2%, driven by an annual decline in capital city dwelling values of 5.2% according to CoreLogic’s annual Best of the Best report.
Meanwhile, regional values increased by 3.3% over the same period.
The estimated total value of residential real estate decreased from $9.6 trillion in December 2021 to $9.4 trillion in November 2022.
The driving force for the property slowdown this year comes down to Australia's fastest interest rate tightening cycle in history.
Higher interest rates limit the amount of borrowing that can be used to purchase a house, which can dissuade buyers from borrowing altogether and lead to less competition in the market.
Other factors that contributed to the weaker value growth included:
- Worsening housing affordability - mortgage serviceability and rent
- Lower consumer sentiment
- High inflation putting pressure on household savings
- Reduction in buyer demand
When summing up the year that was, CoreLogic Head of Research Eliza Owen noted that not all housing markets followed the same downward trend.
“More expensive markets tended to see sharper declines, while the more affordable segment of the market, where buyers typically do not have to extend themselves as much to buy into, saw greater resilience to increases in interest rates,” Ms Owen said.
“The pace of decline has been slowing on a broad basis since September and while this may be seen as a positive by some, there is still risk of the decline re-accelerating in the year ahead.”
The resilient markets versus the susceptible markets
Sydney
Across the capitals, suburbs in Sydney’s City and Inner South, Northern beaches and Eastern suburbs recorded the largest house and unit value declines.
“Houses in Narrabeen, Surry Hills, and Redfern recorded the most significant falls in value over the year, down more than 25%, while unit values in Centennial Park and Mona Vale fell by 23.1% and 20.8% respectively,” said Kaytlin Ezzy, CoreLogic Economist.
Adelaide
On the flip side, Adelaide suburbs took the crown for strongest annual appreciation in value across both houses and units.
House values in Davoren Park rose by 34.7% whilst unit values in Seacliff Park were 41.4% above the levels recorded this time last year.
“While down 0.9% from the July peak, dwelling values across Adelaide are still 13.4% above the level recorded this time last year,” Ms Ezzy said.
“Adelaide's relative affordability and persistently low advertised stock levels have helped insulate it from the worst impacts of rising interest rates.”
Regions
Despite being more resilient to current market conditions, regional values have not been immune to the current downturn.
Suburbs across NSW's Richmond – Tweed region, which were impacted by both rising interest rates and damaging flood events, recorded the largest annual house value declines.
Unit values in Townsville also decreased considerably (-11.8%) in the last 12 months.
Popular lifestyle markets such as the Sunshine Coast, Gold Coast, Southern Highlands and Shoalhaven, and Illawarra have posted some of the strongest peak-to-trough declines in value.
While the regional property market has taken a hit, Ms Ezzy believes it’s unlikely these markets will fall below pre-Covid levels.
“Dwellings across these regions are on average still 38% higher than where they were at the onset of COVID-19,” she said.
What does the 2023 property forecast look like?
Housing market trends in 2023 will largely be shaped by monetary policy and the housing lending environment.
While house value declines have slowed suggesting we may have moved past the peak, Ms Owen says further expected rate rises could jumpstart the pace of decline once again.
“With expectations that the bulk of the rate tightening cycle occurred in 2022, housing value declines could find a floor in the new year,” she said.
“However, the extent of the floor in values could be further weighed down by mortgage serviceability risks, particularly for those rolling out of record-low fixed mortgage rates through the second half of the year.
“On top of that, strong rental markets and improving affordability from the point of falling values, may entice investors and first home buyers into the market, underpinning a recovery in buyer activity in the second half of 2023, when the cash rate stabilises.”
Here are the big-four banks house price predictions for 2023:
- ANZ - decline of 18%
- CommBank - decline of 15%
- Westpac - decline of 16%
- NAB - decline of around 20%
The CoreLogic best of the best 2022 national highlights
Houses
- Most expensive suburb: Vaucluse (NSW) $7,943,965
- Most affordable suburb: Kambalda East (WA) $118,525
- Strongest 12-month growth in values: Bingara (NSW) 36.2%
- Largest 12- month decline in values: Narrabeen (NSW) -26.8%
- Strongest 12-month growth in rents: Clovelly (NSW) 25.1%
- Highest gross rental yields: Kambalda East (WA) 15.9%
Units
- Most expensive suburb: Point Piper (NSW) $2,895,563
- Most affordable suburb: Laguna Quays (QLD) $72,076
- Strongest 12-month growth in values: Seacliff Park (SA) 41.4%
- Largest 12-month decline in values: Centennial Park (NSW) -23.1%
- Strongest 12-month growth in rents: Melbourne (VIC) 38.2%
- Highest gross rental yields: Kalgoorlie (WA) 11.8%
Advertisement
Buying a home or looking to refinance? The table below features home loans with some of the lowest interest rates on the market for owner occupiers.
| Lender | Home Loan | Interest Rate | Comparison Rate* | Monthly Repayment | Repayment type | Rate Type | Offset | Redraw | Ongoing Fees | Upfront Fees | Max LVR | Lump Sum Repayment | Extra Repayments | Split Loan Option | Tags | Features | Link | Compare | Promoted Product | Disclosure |
|---|---|---|---|---|---|---|---|---|---|---|---|---|---|---|---|---|---|---|---|---|
5.54% p.a. | 5.58% p.a. | $2,852 | Principal & Interest | Variable | $0 | $530 | 90% |
| Promoted | Disclosure | ||||||||||
5.49% p.a. | 5.40% p.a. | $2,836 | Principal & Interest | Variable | $0 | $0 | 80% |
| Promoted | Disclosure | ||||||||||
5.64% p.a. | 5.89% p.a. | $2,883 | Principal & Interest | Variable | $250 | $250 | 60% |
| Promoted | Disclosure | ||||||||||
5.64% p.a. | 5.89% p.a. | $2,883 | Principal & Interest | Variable | $248 | $350 | 60% |
| Disclosure |
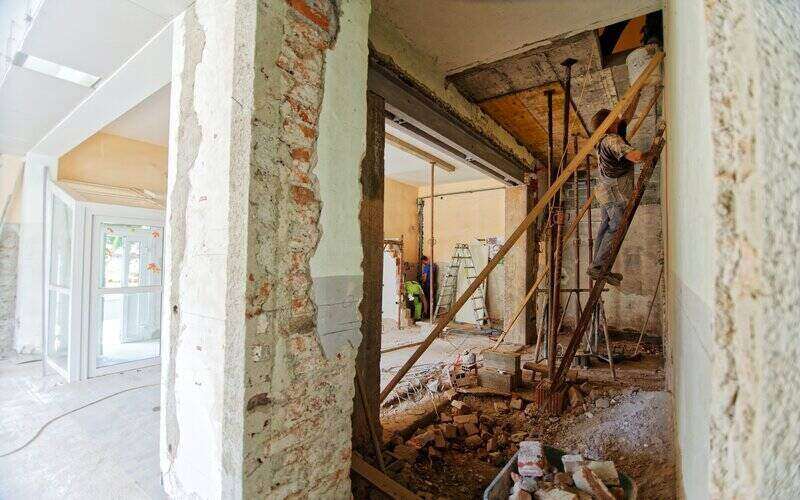
Image by Kelly Sikkema via Unsplash

Ready, Set, Buy!
Learn everything you need to know about buying property – from choosing the right property and home loan, to the purchasing process, tips to save money and more!
With bonus Q&A sheet and Crossword!


 Harry O'Sullivan
 Bea Garcia
 Denise Raward
 Jacob Cocciolone
 Emma Duffy