The Federal Chamber of Automotive Industries (FCAI) has today released the 'VFACTS' report, showing new figures for vehicle sales in June 2022.
Data contained in the report showed sales were down across every State and Territory except for the Northern Territory.
- Northern Territory sales increased by 16.3% with 1,115 vehicles sold.
- Australian Capital Territory sales decreased by11.6% with 1,486 vehicles sold.
- New South Wales sales decreased by 7.5% with 32,027 vehicles sold.
- Queensland sales decreased by 13.2% with 21,983 vehicles sold.
- South Australia sales decreased by 8.6% with 6,214 vehicles sold.
- Tasmania sales decreased by 17.2% with 1,572 vehicles sold.
- Victoria sales decreased by 12.2% with 25,764 vehicles sold.
- Western Australia sales decreased by 2.2% with 9,813 vehicles sold.
Leading the market was Toyota with a total of 22,561 vehicles sold. Kia was next with 8,480 followed by Hyundai (8,259), Mazda (6,245) and Mitsubishi (5,846).
The model taking pole position in June was the Toyota Hi-Lux with 7,582 vehicles sold. Hyundai's Tuscon was next with 2,840 followed by Ford's Ranger (2,802), Toyota's Landcruiser (2,783) and Toyota's Corolla (2,605).
FCAI Chief Executive Tony Weber said the combination of fallout from the COVID-19 pandemic, as well as the war in Ukraine and shipping issues, is the reason for the continued delay of automotive manufacturing.
"Globally, car makers are continuing to suffer from plant shutdowns. In Europe we have component supply heavily impacted by the conflict in Ukraine. Microprocessors continue to be in short supply and global shipping remains unpredictable," Mr Weber said.
"While demand for new cars remains strong in Australia, it is unlikely we will see supply chain issues resolve in the near future.”
The report also highlighted the sharp increase of electric car sales, revealing a 116.2% increase from the 526 electric cars sold in June 2021 compared to the 1,137 sold in June 2022.
To date there have been 9,680 electric vehicles sold this year, a 336.6% increase from the 2,217 that were sold in the same six-month period last year.
Photo by Artem Podrez via Pexels

 Denise Raward
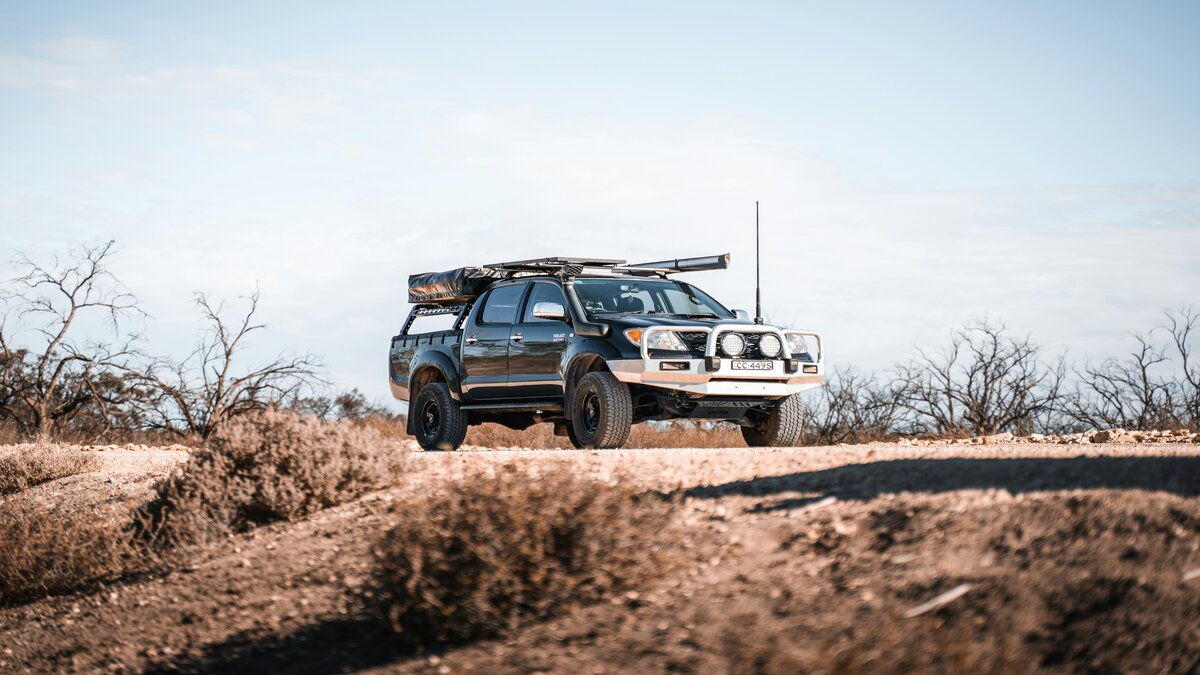
 Harry O'Sullivan