Despite COVID hurdles, the great Australian dream of property ownership appears alive and well with ABS figures revealing two thirds of households own their home outright or with a mortgage.
Breaking down this figure, the ABS revealed households that own a home with a mortgage have increased from 26.2% in 1996 to 35% in 2021, yet over the past 25 years the ABS noted the number of homes owned with a mortgage has increased by 96.8%.
AMP Chief Economist Dr Shane Oliver said this surge in household debt that has accompanied surging home prices over the last 30 years is Australia's 'Achilles Heel'.
"Each successive generation since the Baby Boomers have been progressively more relaxed about taking on debt," Dr Oliver said.
"It’s become somewhat self-feeding in that rising debt has enabled home buyers to pay more for homes which in turn has necessitated rising debt levels to get into the property market."
While average household debt for each Australian has risen from $11,779 in 1990 to $107,318 today, Mr Oliver said the average wealth per person has surged from $87,489 to $655,894.
The growth of wealth and strong savings buffers, coupled with a historically low rate environment, has seen monthly mortgage repayments remain relatively stable over the past five years according to PRD Chief Economist Dr Asti Mardiasmo.
"For renters however, monthly rental repayments based on a four-week per month calculation, have all increased over the past five years," Dr Mardiasmo told Savings.com.au.
"Of course there is a good chance that these figures will be changing very soon, with the increases in cash rate impacting mortgage payments, however that said the availability of rentals continues to decline due to construction challenges and investors exiting the market as associated costs to keeping the investment property makes it financially non-viable."
"Therefore for monthly mortgage repayments to 'catch up' so to speak we would need to see a large increase to the monthly mortgage repayments."
Coastal suburbs hardest hit
There does appear to be one downside to living by the beach, with Dr Mardiasmo noting those living in Noosa and Sunshine Coast are facing the highest increase in housing costs.
"Monthly mortgage repayments have grown 8.3% in Noosa and 6.4% on the Sunshine Coast over the past five years, while monthly rental payments have increased 17.5% in Noosa and 18.9% on the Sunshine Coast over the past five years," she said.
On the other side of the coin, Dr Mardiasmo says Brisbane and Logan City council renters are experiencing the lowest increase in monthly rental repayments at 4.6% and 4.5% respectively over the past five years.
Meanwhile Lockyer Valley and Moreton Bay regional council resisdents have lucked-out in terms of monthly mortgage repayments - falling -1.1% and -0.2% respectively over the past five years.
Advertisement
Buying a home or looking to refinance? The table below features home loans with some of the lowest interest rates on the market for owner occupiers.
| Lender | Home Loan | Interest Rate | Comparison Rate* | Monthly Repayment | Repayment type | Rate Type | Offset | Redraw | Ongoing Fees | Upfront Fees | Max LVR | Lump Sum Repayment | Extra Repayments | Split Loan Option | Tags | Features | Link | Compare | Promoted Product | Disclosure |
|---|---|---|---|---|---|---|---|---|---|---|---|---|---|---|---|---|---|---|---|---|
5.54% p.a. | 5.58% p.a. | $2,852 | Principal & Interest | Variable | $0 | $530 | 90% |
| Promoted | Disclosure | ||||||||||
5.49% p.a. | 5.40% p.a. | $2,836 | Principal & Interest | Variable | $0 | $0 | 80% |
| Promoted | Disclosure | ||||||||||
5.64% p.a. | 5.89% p.a. | $2,883 | Principal & Interest | Variable | $250 | $250 | 60% |
| Promoted | Disclosure | ||||||||||
5.64% p.a. | 5.89% p.a. | $2,883 | Principal & Interest | Variable | $248 | $350 | 60% |
| Disclosure |
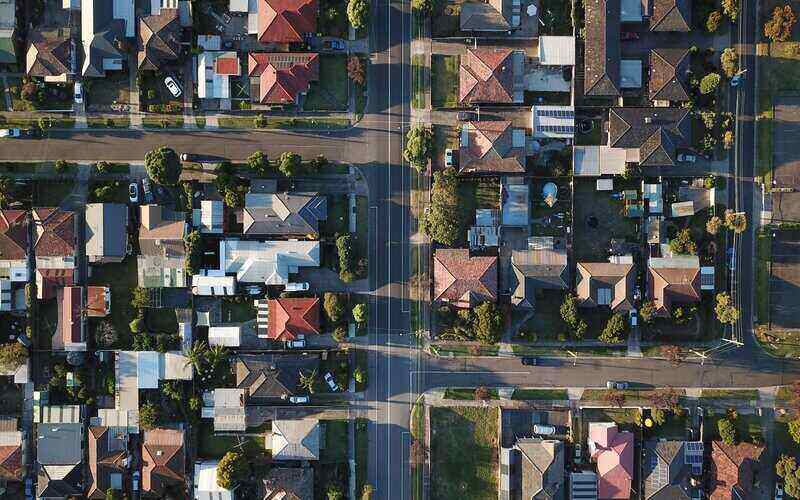
Image by Tom Rumble via Unsplash

Ready, Set, Buy!
Learn everything you need to know about buying property – from choosing the right property and home loan, to the purchasing process, tips to save money and more!
With bonus Q&A sheet and Crossword!


 Harry O'Sullivan
 Bea Garcia
 Denise Raward


