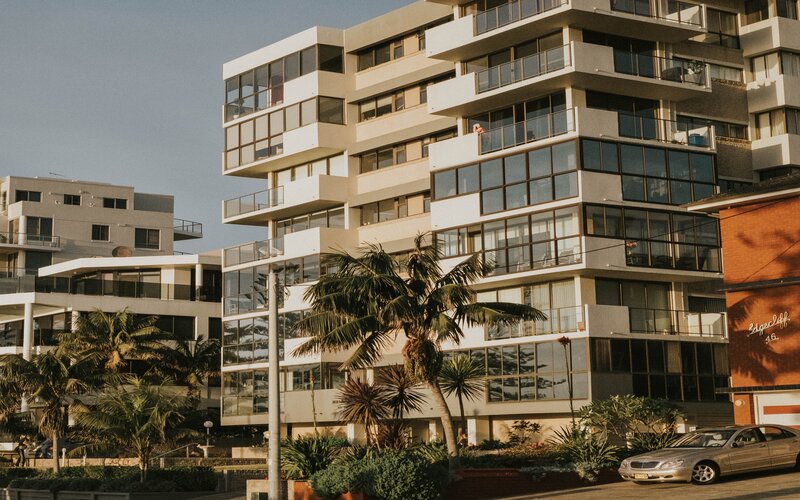
According to PropTrack, just 16.2% of the rental properties listed across Australia were advertised at $400 or less, compared to 30.2% in April 2022.
Excluding regional areas, this drop becomes even more pronounced, with 11.9% of dwellings in the eight capital cities now under the $400 mark compared to 28.1% a year ago.
This is the lowest proportion of cheap rentals PropTrack has ever recorded, and Senior Economist Eleanor Creagh says the rental market is in dire straits.
"Advertised rents are recording strong price increases and vacancies are at historic lows amid a shortage of rental supply," Ms Creagh said.
CoreLogic also reported in the March quarter that rental rates had risen annually by more than 10%, translating to an extra $52 per week ($2,727 annually) for the average Aussie renter.
The 2023 Federal Budget included a $2.7 billion boost to Commonwealth rental assistance in an attempt to bring relief to beleaguered low income tenants.
Individuals will see their rate go up by 15%; the maximum rate is currently $157.20.
However Ms Creagh said this didn't go far enough.
"Although the increase to Commonwealth Rent Assistance is the largest in more than 30 years, rent assistance payments have long fallen behind soaring rental prices," she said.
"The share of affordable rentals is plummeting, meaning conditions remain challenging for low-income Australians."
Capitals market squeeze
PropTrack's report shows how tight rental conditions have become in Australia's largest cities.
With the exception of Adelaide and Darwin, the proportion of rental properties available for $400 or less more than halved in all capital cities.
| April '22 | % in April '23 | |
| Sydney | 18.95% | 9.13% |
| Melbourne | 38.64% | 16.55% |
| Brisbane | 26.36% | 10.89% |
| Adelaide | 36.26% | 21.90% |
| Perth | 30.05% | 8.17% |
| Hobart | 19.71% | 9.83% |
| Darwin | 13.95% | 8.74% |
| Canberra | 5.34% | 1.83% |
Low supply set to continue
While strong migration numbers mean demand for rentals is high, many experts agree that inadequate supply is what's primarily driving the rental crisis.
The Queensland government announced in March it would be limiting landlords to one rental increase per year, a rule already in place in the ACT, but this was criticised by many for failing to address the root cause supply side issues.
NSW Premier Chris Minns has already ruled out a similar policy in Australia's most populous state, citing concerns that this would impact supply by disincentivising property investors.
Simon Pressley of Propertyology believes the average property investor saw costs almost double from February 2022 to 2023, compared to the 10% increase to rental rates.
The Federal Budget included substantial investment that could increase the number of rental properties in the coming years, including tax breaks for build to rent projects and additional funds to increase affordable housing.
The Housing Industry Association (HIA) expect a slowdown to the construction of new homes in the coming months, despite heightened demand and population growth.
"The sharp increase in the cash rate has compounded the barriers created by extraordinary restrictions on lending and investing, increased construction costs and regulatory costs," HIA Chief Economist Tim Reardon says.
"There has been a rapid slowdown in the volume of new building projects entering the pipeline, especially new apartments, over the past year."
Get out of the city?
Although rates are increasing throughout the entire nation, the pressure is softer outside the eight capitals.
The share of rentals listed for $400 or less is 26.6% in regional areas, down 10.6 percentage points from April 2022.
During the pandemic, regional Australia saw a housing squeeze as Aussies surged to less densely populated areas, but now lockdowns and restrictions are behind us, demand is now concentrated once again on the likes of Sydney and Melbourne.
Premier Minns has acknowledged that this is something that concerns his government.
"If we don't get this right and start getting supply moving [in Sydney], we will lose a generation of young people," he said.
Picture by Kane Taylor on Unsplash

Ready, Set, Buy!
Learn everything you need to know about buying property – from choosing the right property and home loan, to the purchasing process, tips to save money and more!
With bonus Q&A sheet and Crossword!

