Nine in 10 rental markets experience a rent increase in the past 12 months

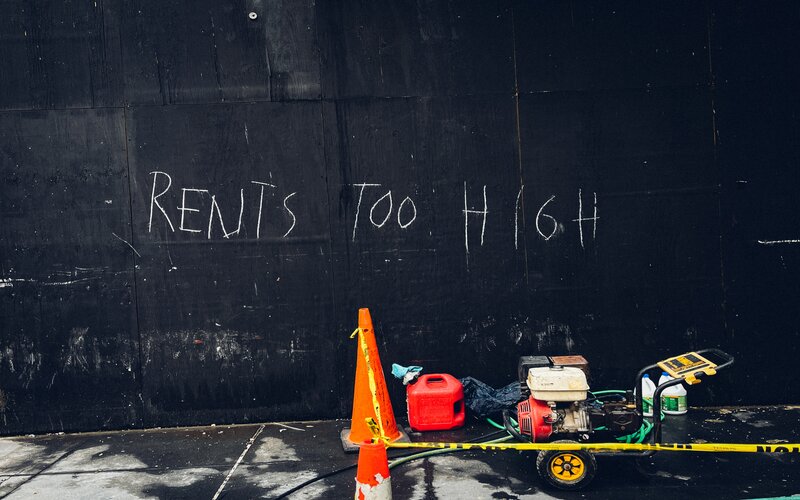
- Nine out of 10 rental markets experienced a rent rise in the past 12 months - Adelaide, Perth, regional WA recorded the most widespread lifts.
- Units in Sydney suburb Haymarket recorded the highest annual rise, up 32.6%.
- Rent values key driver of inflation - ABS data revealed rent inflation jumped 2.5% in the June quarter.
CoreLogic’s Mapping the Market analysis revealed nearly two thirds of unit suburbs across the country recorded an annual increase of 10% or more, as did more than a third of housing markets.
Adelaide, Perth, and regional Western Australia all recorded the most widespread uplifts in rent values across both house and unit markets.
Rental prices in Perth are now 13.4% higher then the same time last year, and 41.8% higher since the beginning of the pandemic.
Looking towards unit rents, Brisbane, Adelaide, Perth and Darwin saw 100% of markets record rent value increases over the last 12 months.
Meanwhile, only six unit markets recorded falls in rent values. They were:
- Sydney - Long Jetty (-3.7%), Wyong (-2.5%) and The Entrance (-0.03%)
- Melbourne - Rosebud West (-2.3%) and Hastings (-0.5%)
- Hobart - Claremont (-0.2%)
CoreLogic Economist Kaytlin Ezzy said a shortage in rental listings is behind the worrying trend.
“Investors tend to shy away from the housing market during negative economic shocks,” Ms Ezzy said.
“The sharp rise in interest rates has coincided with a -23.6% fall in new housing investment lending between April 2022 and May this year.
“On the demand side, record levels of overseas migrants, many of whom rent in inner-city unit precincts, has bolstered rental demand this year, causing an imbalance between rental demand and supply.”
| Region | Suburbs analysed | Annual rent rise number |
| Sydney - houses | 504 | 463 |
| Sydney - units | 285 | 282 |
| Melbourne - houses | 323 | 317 |
| Melbourne - units | 232 | 230 |
| Brisbane - houses | 276 | 275 |
| Brisbane - units | 137 | 137 |
| Adelaide - houses | 197 | 197 |
| Adelaide - units | 60 | 60 |
| Perth - houses | 240 | 240 |
| Perth - units | 94 | 94 |
| Hobart - houses | 39 | 25 |
| Hobart - units | 9 | 8 |
| Darwin - houses | 28 | 20 |
| Darwin - units | 16 | 16 |
| Canberra - houses | 79 | 2 |
| Canberra - units | 41 | 23 |
Units in Sydney’s inner-city market of Haymarket recorded the highest annual rise, up 32.6% - or $276 per week.
This was followed by Georges Hall (31.3%) and Arncliffe (30.9%) in the city’s inner south west.
This comes as CoreLogic’s rental index found median rents in Australia rose 2.5% in the three months to June 2023, down from a 2.8% increase in May.
Ms Ezzy expects the pace of rental growth to moderate over the coming months as “cumulative rental growth pushes more renters to their affordability ceiling.”
Rent inflation a concern
Fresh figures from the ABS revealed annual growth in the cost of services accelerated from 6.1% to 6.3% in the June quarter, underpinned by rent inflation which jumped 2.5%.
This marked the highest quarterly increase since 1988.
Rents have now risen 6.7% annually, led by an 8.9% jump in Brisbane, reflecting the squeeze on vacancy rates.
Further increases are likely on the cards thanks in part to strong overseas migration expected this financial year.
According to CoreLogic, national vacancy rates eased slightly over the June quarter, from 1.1% in March, to 1.2% in June, but remain well below the pre-pandemic decade average (3.3%).
Greens Housing Spokesperson Max Chandler-Mather called on Mr Albanese to coordinate a rent freeze and cap on rent increases.
“With rents surging ahead of CPI, it’s clear that unless the federal government caps rents then it will take much longer to get inflation under control, which means more rate rises,” Mr Chandler-Mather said.
“Rents are driving up the cost of living for everyone.”
Advertisement
Buying a home or looking to refinance? The table below features home loans with some of the lowest interest rates on the market for owner occupiers.
| Lender | Home Loan | Interest Rate | Comparison Rate* | Monthly Repayment | Repayment type | Rate Type | Offset | Redraw | Ongoing Fees | Upfront Fees | Max LVR | Lump Sum Repayment | Extra Repayments | Split Loan Option | Tags | Features | Link | Compare | Promoted Product | Disclosure |
|---|---|---|---|---|---|---|---|---|---|---|---|---|---|---|---|---|---|---|---|---|
6.19% p.a. | 6.23% p.a. | $3,059 | Principal & Interest | Variable | $0 | $530 | 90% |
| Promoted | Disclosure | ||||||||||
5.89% p.a. | 5.80% p.a. | $2,962 | Principal & Interest | Variable | $0 | $0 | 80% |
| Promoted | Disclosure | ||||||||||
6.38% p.a. | 6.66% p.a. | $3,121 | Principal & Interest | Variable | $299 | $0 | 80% | |||||||||||||
6.23% p.a. | 6.23% p.a. | $3,072 | Principal & Interest | Variable | $0 | $395 | 70% | Disclosure |