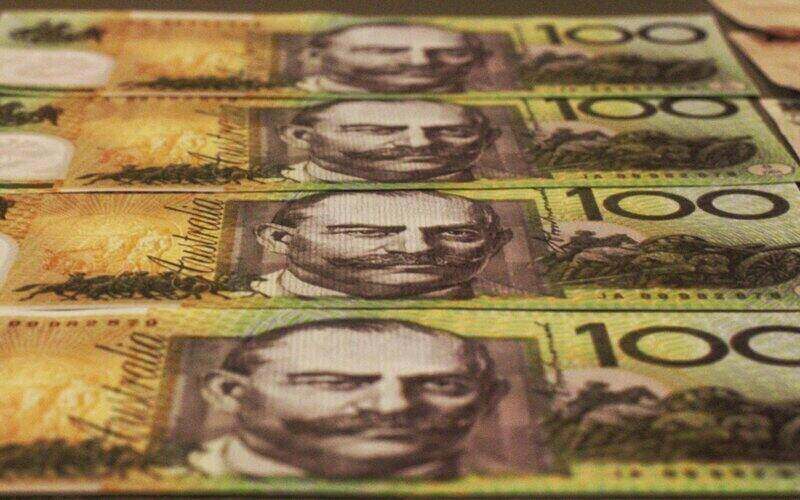
Individuals contributed 51.6% of Australia's total tax take in 2022-23, the first time the figure has cracked the 50% mark.
That's up from 49.6% in 2021-22 and 47.5% the previous financial year.
The upward trend is likely a product of 'bracket creep' where as individuals' pay rises, they find themselves in higher tax brackets.
This means a higher nominal tax take for the government, but can mean a net loss for income earners when inflation is taken into account.
Other factors likely to have contributed to the record personal tax take is strong employment and wages growth in the 2022-23 period.
The finding is contained in the Australian Taxation Office's latest data, released on Friday, for the 2022-23 tax year.
At the same time, the company tax take also increased to 24.2% of Australia's total tax revenue, up from under 20% the previous year.
The company tax proportion tends to fluctuate with the economic times and global markets and likely marks a comeback from the COVID-affected years.
Who earns the most in Australia?
The latest ATO data also ranks the top-earning occupations by average taxable income so if you're looking for a career change, it's worth checking the table below:
| Occupation | Average taxable income |
| Surgeon | $472,475 |
| Anaesthetist | $447,193 |
| Financial dealer | $355,233 |
| Internal medicine specialist | $342,457 |
| Psychiatrist | $286,146 |
| Other medical practitioners | $259,802 |
| Mining engineer | $206,423 |
| Judicial or other legal professionals | $206,408 |
| CEOs or managing directors | $194,987 |
| Financial investment advisor or manager | $191,986 |
Source: ATO 2022-23 Statistics
The data shows 44.9% of Aussies were in the $45,000-$120,000 income bracket, paying 32.5 cents in the dollar in tax (now 30c).
About a quarter (24.4%) fell into the $18,201-$45,000 bracket, paying 19 cents in the dollar (now 16c, falling to 15c then 14c in the next few financial years).
The proportion of Australians earning less than $18,200 was 15.8% while those taking home over $120,000 accounted for 14.8% in 2022-23.
This comes as ABS data shows household wealth increased 0.8% over the March 2025 quarter to a collective $17.31 trillion. For reference, housing stock is worth more than $11 trillion.
Per capita, net wealth in Australia works out to be about $626,740, or roughly $804,000 for everyone aged over 18.
What postcodes earned the most?
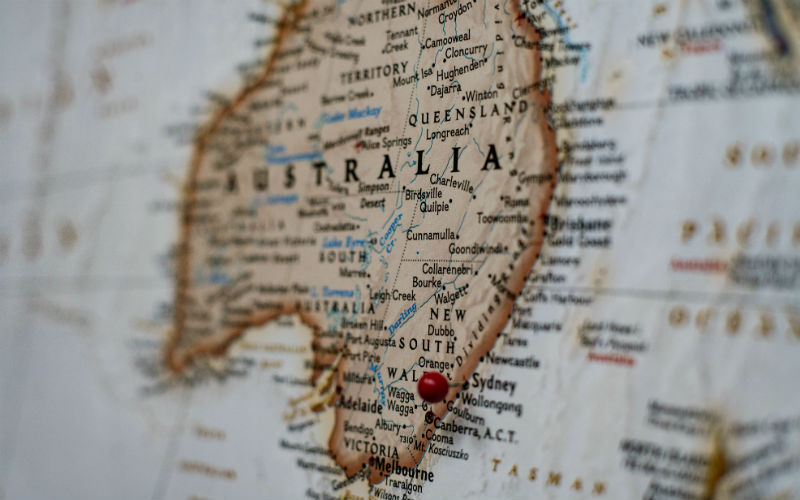
The ATO data also ranks taxable income by postcode with the blue-ribbon Sydney suburbs of 2027 - Darling Point, Edgecliff, HMAS Rushcutters, and Point Piper - topping the chart.
Here were the top income-earning postcodes of Australia in 2022-23:
| Postcode | Suburbs/towns | Taxable income |
| 2027 NSW | Darling Point, Edgecliff, HMAS Rushcutters, Point Piper | $279,712 |
| 2028 NSW | Double Bay | $255,901 |
| 2025 NSW | Woollahra | $242,267 |
| 3142 Vic | Hawksburn, Toorak | $241,511 |
| 2030 NSW | Dover Heights, HMAS Watson, Rose Bay North, Vaucluse, Watsons Bay | $236,750 |
| 2108 NSW | Coasters Retreat, Currawong Beach, Great Mackerel Beach, Palm Beach | $223,344 |
| 3944 Vic | Portsea | $222,254 |
| 2023 NSW | Bellevue Hill | $216,363 |
| 6011 WA | Cottesloe, Peppermint Grove | $213,621 |
| 2110 NSW | Hunters Hill, Woolwich | $208,902 |
Source: ATO 2022-23 Statistics
Is tax reform on the way?
The latest release of official taxation figures comes in the lead-up to the federal Treasurer's roundtable which was originally called to address Australia's productivity problem.
See also: Work more, produce less: Australia's productivity problem
In recent weeks, its scope seems to have widened to look at broader economic reform including taxation.
Many tax experts believe the Australian system is too focused on taxing personal income rather than spending or wealth.
There has been speculation Australia's Goods and Services Tax (GST), which has remained at 10% since its inception 25 years ago, may be in line for an increase.
The federal Labor government has also announced its intention to impose more tax on superannuation balances over $3 million, plus the provision to tax unrealised gains.
The latest ATO statistics show superannuation contributed 4.2% to Australia's total tax take in 2022-23.
The productivity roundtable is set down for August.
Advertisement
Need somewhere to store cash and earn interest? The table below features savings accounts with some of the highest interest rates on the market.
| Bank | Savings Account | Base Interest Rate | Max Interest Rate | Total Interest Earned | Introductory Term | Minimum Amount | Maximum Amount | Linked Account Required | Minimum Monthly Deposit | Minimum Opening Deposit | Account Keeping Fee | ATM Access | Joint Application | Tags | Features | Link | Compare | Promoted Product | Disclosure |
|---|---|---|---|---|---|---|---|---|---|---|---|---|---|---|---|---|---|---|---|
3.70% p.a. | 5.15% p.a. Intro rate for 4 months then 3.70% p.a. | $844 | 4 months | $0 | $249,999 | $0 | $1 | $0 |
| ||||||||||
4.50% p.a. | 4.85% p.a. Intro rate for 4 months then 4.50% p.a. | $933 | 4 months | $0 | $99,999,999 | $0 | $0 | $0 |
| ||||||||||
4.20% p.a. | 4.95% p.a. Intro rate for 4 months then 4.20% p.a. | $899 | 4 months | $250,000 | $99,999,999 | $0 | $0 | – |
| Promoted | Disclosure | ||||||||
3.05% p.a. | 4.85% p.a. Intro rate for 4 months then 3.05% p.a. | $736 | 4 months | $0 | $99,999,999 | $0 | $0 | – |
| Promoted | Disclosure | ||||||||
0.00% p.a. Bonus rate of 4.85% Rate varies on savings amount. | 4.85% p.a. | $992 | – | $0 | $99,999 | $0 | $0 | $0 |
| Disclosure |


")
Image by Pat Whelen via Pexels

Ready, Set, Buy!
Learn everything you need to know about buying property – from choosing the right property and home loan, to the purchasing process, tips to save money and more!
With bonus Q&A sheet and Crossword!

 Harrison Astbury
 Brooke Cooper