Despite recording an increase from the 81,065 vehicles sold in April, the Federal Chamber of Automotive Industries (FCAI) 'VFACTS' report revealed new car sales were down 6.4% in the month of May compared to the year prior.

FCAI Chief Executive Tony Weber said despite car makers continuing to report high demand across dealer showrooms and online marketplaces, global supply chains struggling to recover from pandemic impacts meant demand for new vehicles in Australia continues to outstrip supply.

"Pandemic interruptions continue to impact manufacturing and conflict in Ukraine has disrupted vehicle component supply," Mr Weber said.

"Monthly sales figures are also dependent on shipping arrivals which continue to be uncertain.

"We do not expect supply chains to stabilise until these issues are resolved.”

The VFACTS report revealed state-by-state sales statistics compared to May 2021, noting:

  • Northern Territory sales increased 2.4% with 973 vehicles sold.
  • Australian Capital Territory sales decreased 11% with 1,367 vehicles sold.
  • Tasmania sales decreased 6.8% with 1,651 vehicles sold.
  • New South Wales sales decreased 6.3% with 30,757 vehicles sold.
  • Victoria sales decreased 0.8% with 25,164 vehicles sold.  
  • Queensland sales decreased 11.3% with 18,997 vehicles sold.
  • South Australia sales decreased 8.2% with 6,098 vehicles sold.
  • Western Australia sales decreased 9.1% with 9,353 vehicles sold.

EVs buck the trend as Volvo claims pole position for May

Electric vehicle sales continue their upward trend across 2022, with the report revealing 925 were sold in May marking an increase of 112% when compared to May 2021.

There have been 8,543 electric vehicles sold in 2022, with a 405.2% increase across the same five-month period from 2021.

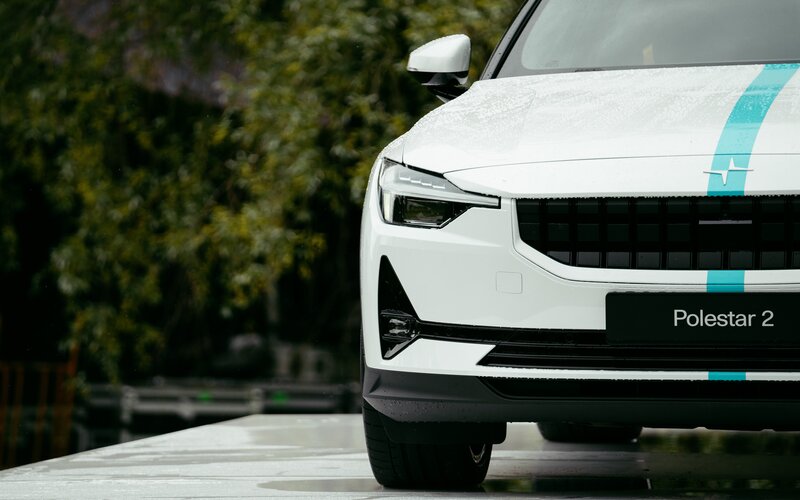
Volvo XC40 recharge led the way with 174 sales in May, while Polestar 2 coming off the back of pole position in April was not far behind with 153 sales.

Tesla managed only 12 vehicle sales in May as deliveries were recently placed on hold until the second half of the year amid lockdowns in China.


Advertisement

In the market for a new car? The table below features green car loans with some of the lowest interest rates on the market for low-emissions vehicles.

Update resultsUpdate
LenderCar LoanInterest Rate Comparison Rate* Monthly Repayment Interest Type Vehicle Type Maximum Vehicle Age Ongoing Fee Upfront Fee Total Repayment Early Repayment Instant Approval Online Application TagsFeaturesLinkCompare
6.09% p.a.
7.21% p.a.
$581
Variable
New
1 year
$8
$400
$34,874
Featured
  • Discounted rate on qualifying electric cars
  • Up to 7 yrs loan term
  • Redraw available up to $5,000/day
5.99% p.a.
7.20% p.a.
$580
Fixed
New, Used
7 years
$12
$250
$34,791
5.99% p.a.
5.99% p.a.
$580
Variable
New
No Max
$0
$0
$34,791
6.19% p.a.
6.54% p.a.
$583
Variable
New
No Max
$0
$250
$34,958
6.25% p.a.
6.52% p.a.
$583
Fixed
New, Used
3 years
$0
$195
$35,009
Important Information and Comparison Rate Warning

All products with a link to a product provider’s website have a commercial marketing relationship between us and these providers. These products may appear prominently and first within the search tables regardless of their attributes and may include products marked as promoted, featured or sponsored. The link to a product provider’s website will allow you to get more information or apply for the product. By de-selecting “Show online partners only” additional non-commercialised products may be displayed and re-sorted at the top of the table. For more information on how we’ve selected these “Sponsored”, “Featured” and “Promoted” products, the products we compare, how we make money, and other important information about our service, please click here.

The comparison rates in this table are based on a loan of $30,000 and a term of 5 years unless indicated otherwise. The comparison rates for car loans and secured personal loans for the relevant amounts and terms are for secured loans unless indicated otherwise. The comparison rates for unsecured personal loans are applicable for unsecured loans only. WARNING: This comparison rate applies only to the example or examples given. Different amounts and terms will result in different comparison rates. Costs such as redraw fees or early repayment fees, and cost savings such as fee waivers, are not included in the comparison rate but may influence the cost of the loan. Comparison rates are not calculated for revolving credit products.

Monthly repayment figures are estimates only, exclude fees and are based on the advertised rate for the term and for the loan amount entered. Actual repayments will depend on your individual circumstances and interest rate changes. Rates correct as of . View disclaimer.

Image by Philip Myrtorp via Unsplash