Gen-Xers and Millennials accounted for the largest proportion of movers from capital cities to regional areas in the 12 months to March 2022, according to research from CommBank and the Regional Australia Institute’s Regional Movers Index.
According to the data, the number of people moving to regional areas rose by 16.6% in the March quarter, the highest the country has seen in five years.
Commonwealth Bank regional and agribusiness banking executive general manager Paul Fowler explains why regional areas are attractive to Australians.
“Regional Australia is thriving, fuelled by strong investment across a broad range of industries including agriculture, manufacturing, retail and hospitality,” Mr Fowler said.
“There are labour shortages in many parts of regional Australia and local businesses are attracting skilled and unskilled workers to increase capacity and serve growing demand for products and services.”
South Australia had the highest demand for regional living with the three local governments of Ceduna, Mount Gambier, and Port Augusta recording the biggest growth rates in the 12 months to March 2022.
In Ceduna, the number of capital-city people moving in during the 12 months to March 2022 more than doubled the previous 12 months at 114%.
Two thirds (66%) of movers were Millennials.
Growth in Mount Gambier and Port Augusta was also high at 85% and 74% respectively.
Millennials accounted for the highest proportion of regional movers in these two areas with 70% in Mount Gambier and 76% in Port Augusta.
“Mount Gambier is perfectly positioned between Adelaide and Melbourne with wonderful amenities and work opportunities in a diverse range of industries including manufacturing, agriculture, civil construction and wholesale retail,” Mr Fowler said.
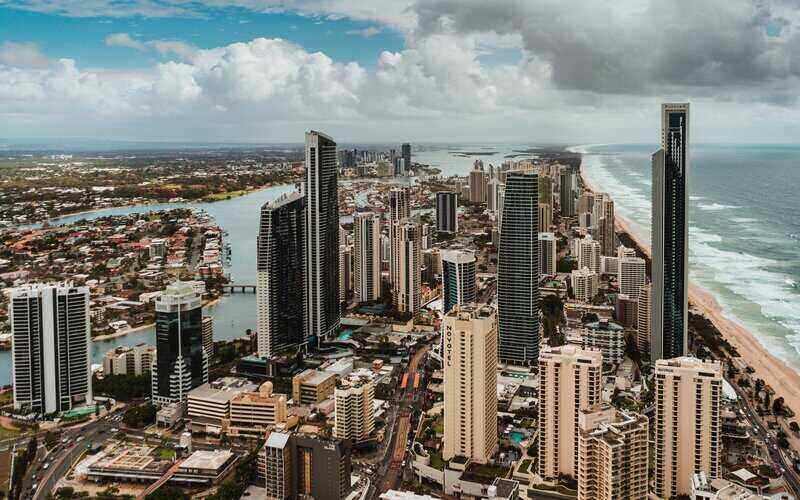
The Western Downs in Queensland and Moorabool in Victoria finished out the top five with both areas experiencing a 56% growth rate in regional living.
Liz Ritchie, Regional Australia Institute (RAI) chief executive officer said Gen-Xers and Millennials are a positive addition to regional areas as they often bring viable skills to help grow the community.
“Regional living is attracting more young people and particularly younger families who are looking for bigger living spaces at a cheaper cost,” Ms Ritchie said.
Growing families seek regional living in NSW
According to Domain’s New South Wales Spotlight Report, Gen-Xers and Millennials are getting back into the driver’s seat and relocating into regional NSW.
People in the prime of their working years (25-44 years) with young families are the biggest group moving to regional NSW for the affordability, relaxing lifestyle, and space.
Thirty-three percent of the total inquiries made on Domain to regional NSW have been from Sydney.
With more people making the move into regional areas, buyers have begun to prioritise what’s most important when looking for a new home such as the neighbourhood and surrounding area they are buying.
It’s also refocused people’s attention on appealing lifestyle opportunities such as residing close to a beach or river.
The Domain report found the most bought property type in regional NSW are houses at 79%; units, 15%; and townhouses, 6%.
When looking for a particular type of property, buyers prefer:
- Houses with 4 bed, 2 bath, 2 car
- Townhouses with 2 bed, 1 bath, 1 car
- Units with 2 bed, 1 bath, 1 car
The suburbs with the most sales for houses in regional NSW include Port Macquarie, Orange, Dubbo, Armidale, and Goulburn. For units it includes Wollongong, Newcastle, Port Macquarie, Tweed Heads, and Nelson Bay.
Nearly two thirds (65%) of suburbs in regional NSW have a median house price below $800,000 while for unit's it's 91%.
Advertisement
Buying a home or looking to refinance? The table below features home loans with some of the lowest interest rates on the market for owner occupiers.
| Lender | Home Loan | Interest Rate | Comparison Rate* | Monthly Repayment | Repayment type | Rate Type | Offset | Redraw | Ongoing Fees | Upfront Fees | Max LVR | Lump Sum Repayment | Extra Repayments | Split Loan Option | Tags | Features | Link | Compare | Promoted Product | Disclosure |
|---|---|---|---|---|---|---|---|---|---|---|---|---|---|---|---|---|---|---|---|---|
5.54% p.a. | 5.58% p.a. | $2,852 | Principal & Interest | Variable | $0 | $530 | 90% |
| Promoted | Disclosure | ||||||||||
5.49% p.a. | 5.40% p.a. | $2,836 | Principal & Interest | Variable | $0 | $0 | 80% |
| Promoted | Disclosure | ||||||||||
5.64% p.a. | 5.89% p.a. | $2,883 | Principal & Interest | Variable | $250 | $250 | 60% |
| Promoted | Disclosure | ||||||||||
5.64% p.a. | 5.89% p.a. | $2,883 | Principal & Interest | Variable | $248 | $350 | 60% |
| Disclosure |


")

Image by cottonbro via Pexels

Ready, Set, Buy!
Learn everything you need to know about buying property – from choosing the right property and home loan, to the purchasing process, tips to save money and more!
With bonus Q&A sheet and Crossword!


 Denise Raward
 Harry O'Sullivan

 Harrison Astbury
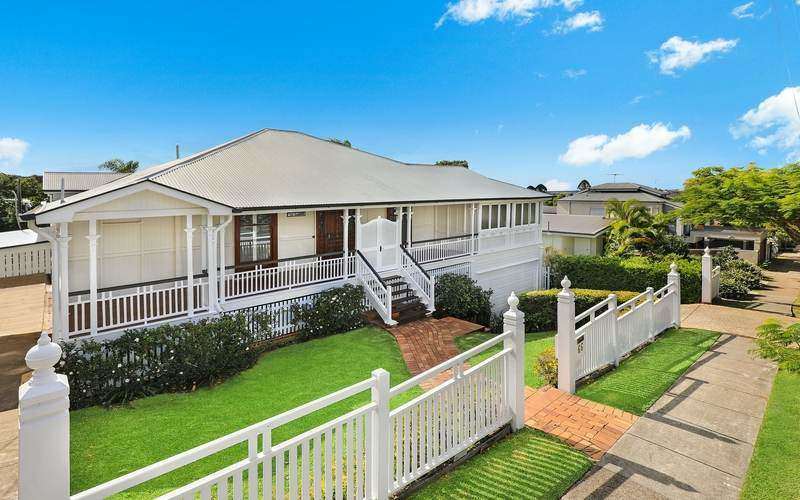
 Rachel Horan