Despite home loan activity continuing to decline, housing affordability has worsened according to Bluestone's latest market report.
The Home Loan Affordability Index, which measures the average income needed to meet loan repayments, has risen above the long-term average of 86.8 for the first time since 2016.
For the July quarter, the index has risen to 90.1. According to the report, this indicates the 'clear' prospect of easing house price growth and fewer home loans.
As a result of the housing boom, borrowers now have to borrow more.
However, this combined with 'subdued' income growth and 'flat' interest rates has resulted in a higher proportion of income required to meet loan repayments.
The report says that 'strict' lending conditions should 'place a ceiling' on the borrowing capacity of buyers, which should result in reduced demand and price growth.
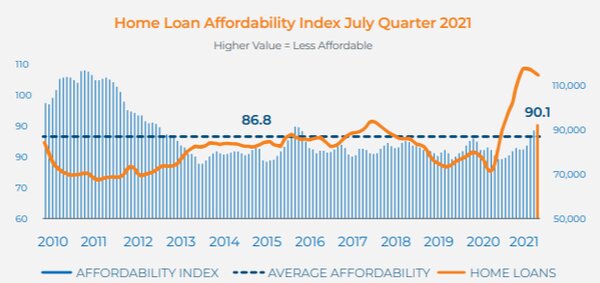
Source: Bluestone
Affordability contingent on low mortgage rates
Moody's Investors Service attributed worsening affordability to stagnating wages.
"We expect housing affordability will continue to deteriorate moderately for rest of 2021 and into early 2022, because property prices will continue to increase while mortgage lending rates and household incomes will stay broadly steady," Moody's analyst Pratik Joshi said.
Mr Joshi said mortgage lending rates declining 20 basis points on average since March was not enough to offset "worsening" housing affordability.
"Mortgage lending interest rates have likely bottomed and will stay at around current low levels for some time, with the potential for rate rises increasing after 18-24 months if inflation grows," he said.
Moody's Investors Service's modelling shows Sydney housing affordability could be at its worst in a decade should house prices increase by a further 4.6% or if average mortgage rates increase by 42 basis points.
Australia wide, if average mortgage rates increased from 3.45% to 3.87%, affordability would be at its worst in more than a decade.
NSW mulls axing capital gains concessions as investor lending picks up
According to Bluestone's research, all states reported declines in owner-occupier home loans except for NSW, despite recording strong annual growth in lending.
Additionally, NSW topped the investor market as the 'most active' state with a loan book value of $3.87 billion.
In a submission to a federal inquiry on housing affordability, the NSW Government suggested the Commonwealth review the 50% capital gains tax discount.
"These tax benefits of property investment have contributed to the growing housing affordability issue," the submission read.
However, Arjun Paliwal, Founder and Head of Research at InvestorKit, said the tax breaks don't create an environment for investor speculation as suggested.
"ABS lending indicators demonstrate that pre-COVID 'new loan commitments' were declining to investors. This reached $10.078 billion in April 2015, reducing to $4.225 billion in May 2020, declining in between," Mr Paliwal said.
"Between February 2004 to May 2021, new loan commitments to investors did not hit double the amount, whilst loans to owner-occupiers, excluding refinance, almost tripled during the same period."
Mr Paliwal said these numbers suggest tax breaks such as the 50% capital gains exemptions do 'very little' to create investor speculation.
"Removing this will only create greater supply constraints, as investors will hold on to assets for longer to create gains worth selling for if this tax is removed," Mr Paliwal said.
"In turn, it can create greater price rises, the opposite of what the thought on this policy is."
First home buyers fall as average loan value surges
All states reported falls in first home buyers except for ACT according to Bluestone's research.
This comes as the average home loan value continues to surge and remains 'well ahead' of the values recorded this time last year.
Owner-occupiers have reported the 'sharpest' increases, followed by investors, first home owners, and home building loans.
NSW takes the cake with the highest average home loan and annual growth rates for most types of loans.
Advertisement
Buying a home or looking to refinance? The table below features home loans with some of the lowest interest rates on the market for owner occupiers.
| Lender | Home Loan | Interest Rate | Comparison Rate* | Monthly Repayment | Repayment type | Rate Type | Offset | Redraw | Ongoing Fees | Upfront Fees | Max LVR | Lump Sum Repayment | Extra Repayments | Split Loan Option | Tags | Features | Link | Compare | Promoted Product | Disclosure |
|---|---|---|---|---|---|---|---|---|---|---|---|---|---|---|---|---|---|---|---|---|
5.54% p.a. | 5.58% p.a. | $2,852 | Principal & Interest | Variable | $0 | $530 | 90% |
| Promoted | Disclosure | ||||||||||
5.49% p.a. | 5.40% p.a. | $2,836 | Principal & Interest | Variable | $0 | $0 | 80% |
| Promoted | Disclosure | ||||||||||
5.64% p.a. | 5.89% p.a. | $2,883 | Principal & Interest | Variable | $250 | $250 | 60% |
| Promoted | Disclosure | ||||||||||
5.64% p.a. | 5.89% p.a. | $2,883 | Principal & Interest | Variable | $248 | $350 | 60% |
| Disclosure |


")

Image by Dmitry Osipenko on Unsplash

Ready, Set, Buy!
Learn everything you need to know about buying property – from choosing the right property and home loan, to the purchasing process, tips to save money and more!
With bonus Q&A sheet and Crossword!


 Harry O'Sullivan
 Bea Garcia
 Denise Raward
 Rachel Horan
 Hanan Dervisevic