CoreLogic’s national home value index revealed dwelling prices grew 1.5% in August, a rate well above average but the slowest growth rate since January.
According to CoreLogic, this is proof that the rate of price growth is moderating from its peak in March when it rose 2.8%.
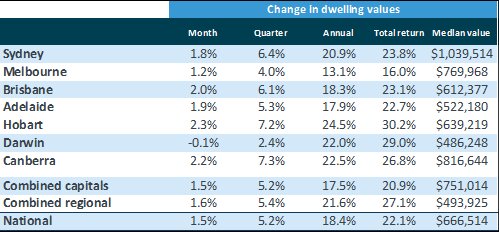
From January to August, property prices have risen 15.8%. Over the last 12 months, dwelling values have increased by 18.4%.
This represents an increase of $103,400 over the last year, or $1,990 per week.
On the other hand, wage growth has 'plateaued', rising at an annualised rate of 1.7% and offset by an inflation figure of 3.8%.
CoreLogic's research director, Tim Lawless, said this disparity is making it harder for people buy property for the first time.
"Housing prices have risen almost 11 times faster than wages growth over the past year," Mr Lawless said.
"It’s likely the ongoing shortage of properties available for purchase is central to the upwards pressure on housing values."
Capital city house prices outpaced units but the gap is 'narrowing'
The first quarter of this year saw house prices rise 1.1 percentage points faster than units each month.
In August, this gap fell to 0.7 percentage points.
According to Mr Lawless, this could be another indicator that affordability is 'becoming more challenging'.
August saw dwelling prices grew in every capital city except for Darwin which retracted 0.1%.
Canberra saw the largest increase of 2.2%.
Slightly behind Canberra was Brisbane with a 2% increase in dwelling values; Adelaide saw a rise of 1.9%; and Sydney prices rose 1.8% despite its ongoing lockdown.
Perth was not included because of a divergence in measurements.
Source: CoreLogic
Rental growth softening but 'remains strong'
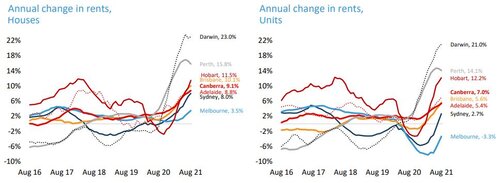
Rental prices have risen 8.2% over the past 12 months, which is the largest surge in 13 years.
There is a price growth disparity between houses and units for rent, as house rental price growth more than doubled unit prices in August.
Nationally, rental prices for houses increased 9.9% but only 4% for units.
This difference is 'most pronounced' in Sydney and Melbourne, but most capital cities are seeing the same pattern.
Mr Lawless said this weaker trend is due to fewer temporary tenants from overseas, closed borders, and an unprecedented surge in inner city apartments.
Gross rental yields have reached an 'all-time low' of 3.32%, with historic lows in Brisbane (3.99%); Hobart (4.01%); and Canberra (3.99%).
This is due to compression caused by house prices rising 18.4% while rents increased by 8.2%.
Source: CoreLogic
Advertisement
Buying a home or looking to refinance? The table below features home loans with some of the lowest interest rates on the market for owner occupiers.
| Lender | Home Loan | Interest Rate | Comparison Rate* | Monthly Repayment | Repayment type | Rate Type | Offset | Redraw | Ongoing Fees | Upfront Fees | Max LVR | Lump Sum Repayment | Extra Repayments | Split Loan Option | Tags | Features | Link | Compare | Promoted Product | Disclosure |
|---|---|---|---|---|---|---|---|---|---|---|---|---|---|---|---|---|---|---|---|---|
5.54% p.a. | 5.58% p.a. | $2,852 | Principal & Interest | Variable | $0 | $530 | 90% |
| Promoted | Disclosure | ||||||||||
5.49% p.a. | 5.40% p.a. | $2,836 | Principal & Interest | Variable | $0 | $0 | 80% |
| Promoted | Disclosure | ||||||||||
5.64% p.a. | 5.89% p.a. | $2,883 | Principal & Interest | Variable | $250 | $250 | 60% |
| Promoted | Disclosure | ||||||||||
5.64% p.a. | 5.89% p.a. | $2,883 | Principal & Interest | Variable | $248 | $350 | 60% |
| Disclosure |


")

Image by Pat Whelen on Unsplash

Ready, Set, Buy!
Learn everything you need to know about buying property – from choosing the right property and home loan, to the purchasing process, tips to save money and more!
With bonus Q&A sheet and Crossword!


 Denise Raward
 Harry O'Sullivan

 Rachel Horan