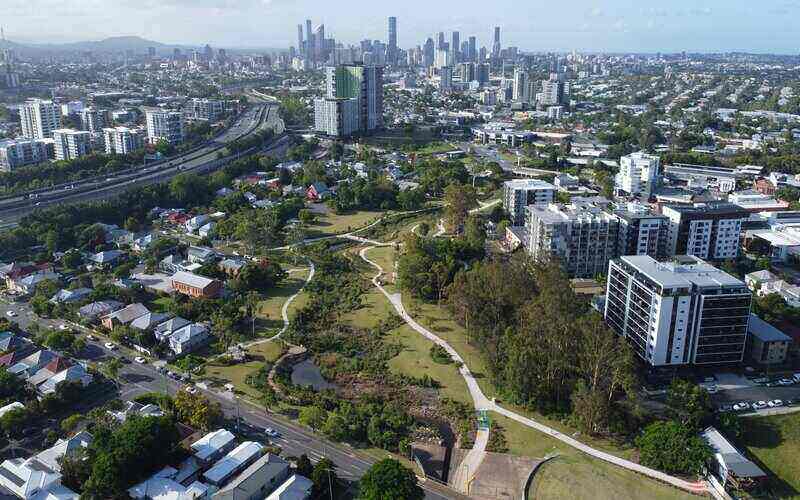
A shortage of land on which to build could be behind much of Australia’s housing crisis, and the situation could be set to continue, according to CoreLogic and the Housing Industry Association (HIA).
The latest quarterly HIA-CoreLogic Residential Land Report found the volume of residential land transactions slumped 37% over the 12 months to March 2023.
“This will see the volume of new home commencements slow over the next year,” HIA Senior Economist Tom Devitt said.
An acute shortage of land available to build housing has driven Australia’s median lot price up 23% over the three years to March, compared to a 5% lift over the three years prior.
“Decisions made today about land release can be expected to affect housing supply ten years from now," Mr Devitt said.
“The time it takes to progress from a vacant block of land to a block that is shovel-ready with titles could be a major roadblock to the government’s plan to build a million homes over the next five years.”
For the first time in nearly a decade, all capital cities have seen land prices increase year-on-year.
The median lot value across all the capitals in the first quarter of 2023 was $366,104 – a 1.9% increase on that of 2022.
The most expensive city to buy land was Sydney, with the median lot in Greater Sydney reaching $664,000 in the March quarter – a 0.5% year-on-year increase.
Greater Adelaide’s median lot value rose 7.4% to $234,216 – making it the cheapest capital – while that of Greater Brisbane posted the biggest gain, rising 9.4% to $290,000.
|
City |
Median lot value |
Year-on-year change |
Median lot size |
Price per square metre |
Year-on-year change (price per square metre) |
|
Greater Sydney |
$664,000 |
0.5% |
375sqm |
$1,827 |
10.4% |
|
Greater Melbourne |
$411,000 |
6.8% |
400sqm |
$1,058 |
3.4% |
|
Greater Brisbane |
$290,000 |
9.4% |
442sqm |
$715 |
14.2% |
|
Greater Adelaide |
$234,216 |
7.4% |
400sqm |
$528 |
-3.7% |
|
Greater Perth |
$261,625 |
5.9% |
377sqm |
$725 |
3.7% |
|
Greater Hobart |
$307,500 |
2.5% |
607sqm |
$482 |
-1% |
Source: CoreLogic, HIA Economics
“While sales numbers have eased significantly from the peak volumes seen during the HomeBuilder scheme, it will take some time before we see a more notable recovery in supply levels,” CoreLogic economist Kaytlin Ezzy said.
“Until then, we can expect land prices will remain elevated, dwelling approvals will continue to track below average, and house commencements will continue easing.”
Appearing in front of a housing economics committee on Friday, outgoing Reserve Bank of Australia (RBA) governor Dr Philip Lowe said zoning reform was needed to increase housing affordability.
“Regulation, particularly around zoning, is one of the biggest issues we face at the moment in the high cost of housing in the country,” Dr Lowe said.
“Housing is expensive not because the cost of building a house or an apartment is expensive - it’s the land.”
Advertisement
Buying a home or looking to refinance? The table below features home loans with some of the lowest interest rates on the market for owner occupiers.
| Lender | Home Loan | Interest Rate | Comparison Rate* | Monthly Repayment | Repayment type | Rate Type | Offset | Redraw | Ongoing Fees | Upfront Fees | Max LVR | Lump Sum Repayment | Extra Repayments | Split Loan Option | Tags | Features | Link | Compare | Promoted Product | Disclosure |
|---|---|---|---|---|---|---|---|---|---|---|---|---|---|---|---|---|---|---|---|---|
5.54% p.a. | 5.58% p.a. | $2,852 | Principal & Interest | Variable | $0 | $530 | 90% |
| Promoted | Disclosure | ||||||||||
5.49% p.a. | 5.40% p.a. | $2,836 | Principal & Interest | Variable | $0 | $0 | 80% |
| Promoted | Disclosure | ||||||||||
5.64% p.a. | 5.89% p.a. | $2,883 | Principal & Interest | Variable | $250 | $250 | 60% |
| Promoted | Disclosure | ||||||||||
5.64% p.a. | 5.89% p.a. | $2,883 | Principal & Interest | Variable | $248 | $350 | 60% |
| Disclosure |
Image by Scotty McDonald on Unsplash

Ready, Set, Buy!
Learn everything you need to know about buying property – from choosing the right property and home loan, to the purchasing process, tips to save money and more!
With bonus Q&A sheet and Crossword!


