The data found the combined value of residential real estate in Australia had fallen to $9.6 trillion at the end of September, down from $9.7 trillion in the previous month.
The quarterly 4.1% decline marks the most pronounced quarterly fall since the 1980s.
However, dwelling values across Australia are 1.7% higher than they were this time last year, down significantly from a cyclical peak of 22.4% growth recorded in the 12 months to January 2022.
While the housing market downswing became more widespread, the monthly rate of decline slowed to -1.4% in September, from -1.6% through August.
Regional South Australia recorded the highest annual growth rate in dwelling values among the regional and capital city dwelling markets, up 22.2% - Sydney had the lowest, falling 6.0% over the year.
Buyer demand is beginning to slow across the nation, resulting in lower sales volume – in the 12 months to September, CoreLogic estimates there were 566,609 sales nationally, down 5.2% compared to the previous year.
According to the report, properties are taking longer to sell, with the average number of days on the market being 35 in the three months to September – up from a low of 20 days over the quarter to November.
This is broadly consistent with national data from SQM Research, which showed a 9.2% monthly (August to September) rise in listings older than 180 days.
Similarly, vendor discounting – the difference between the original asking price of a property and its eventual sale price – has also increased from the recent low of -2.9% recorded in the quarter to November last year according to CoreLogic.
In the three months to September, the average vendor discount at the national level was 4.2%.
Across the nation, there were 34,368 newly advertised dwellings listed for sale in the four weeks to October 2.
Despite the volume of new listings seeing a slight increase compared to the 28 days to 29th September, the flow of new listings is 14.3% lower than the previous five-year average.
Throughout September, the combined capital cities clearance rate trended higher - averaging 59.8% in the five weeks to September 25th.
While this figure is up from the average recorded over August (56.8%), it is down from 74.3% in the equivalent period of 2021.
The rental value growth remains high across Australian dwellings, however the annual growth in house rents has shown signs of moderating growth, falling to 9.4% in the 12 months to September.
Unit rent values have also seen increased momentum, rising 11.8% over the past year - which saw annual rental growth across national dwellings hold steady at 10.0%.
Gross rent yields across Australia also reported an increase, with a 3.57% rise through September – up from a recent low of 3.21% in February this year.
In October, the RBA lifted rates to 2.60%, taking the cash rate target slightly higher than the pre-COVID decade average of 2.55%.
Since the end of 2021, gross rent yields in Sydney have lifted 51 basis points, and 35 basis points in Melbourne.
Unit dwelling approvals through August virtually doubled on the previous month, taking total approvals 28.1% higher across houses and units.
However, despite the rise monthly unit approvals remained below the decade average of 7,456.
National vacancy rates remained constant through September
SQM Research revealed the national rental vacancy rate is at its tightest since 2006, at 0.9%.
Across Australia, the total number of rental vacancies currently stands at 33,813 residential properties – a slight increase from 32,948 in August.
Sydney and Melbourne vacancy rates remained constant at 1.3% and 1.4% and Canberra increased from 0.9% to 1%.
In the smaller capital cities, Brisbane, Perth, Adelaide, Darwin and Hobart, vacancy rates sat well below 1.0% and all with the exception of Darwin recorded a rise in vacancies over September.
In the Melbourne CBD, vacancy rates rose slightly to 2.3%, Sydney CBD remained constant at 3.1% and Brisbane CBD rose 2%.
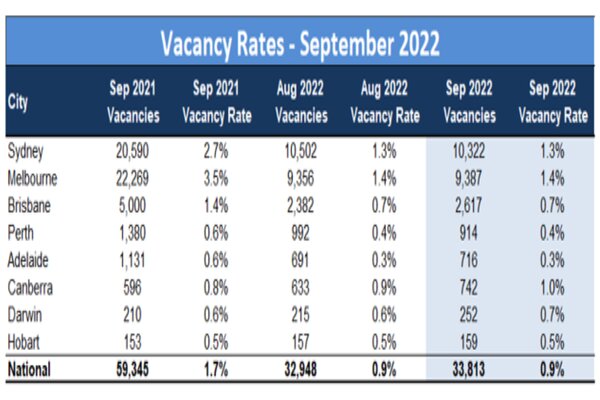
Source: SQM Research
Louis Christopher, Managing Director of SQM Research said while the rental vacancy rate remained steady at 0.9%, there was actually a slight increase in vacancies over the month, driven by a rise in new rental listings compared to August.
"We note there was also a rise in rental vacancies within the Sydney, Melbourne, and Brisbane CBDs," Mr Christopher said.
"Overall, the rental market remains extraordinarily tight and so it is little surprise to note yet another month of asking rent increases, over the past 30 days we have combined national asking rents up by a further 1%.
"Going forward, history tells us when we reach the late spring, early summer period, we could see a seasonal increase in vacancies. However there remains a structural issue with the rental market for which increases in construction of new dwellings will only resolve."
Rents are on the rise
SQM Research also revealed that over the past 30 days to 12 October 2022, capital city asking rents rose by another 1.4% – with the 12-month rise now standing at 21.8%.
While broader national rents when taking into account all regions, rose by 14.7% for the same 12-month period.
The national median weekly asking rent for a dwelling was recorded at $530.50 a week.
The highest weekly rent for a house was recorded in Sydney, at $854.92 a week – while Adelaide units offered the best rental affordability of all capital cities at $495.46 a week.
Advertisement
Buying a home or looking to refinance? The table below features home loans with some of the lowest interest rates on the market for owner occupiers.
| Lender | Home Loan | Interest Rate | Comparison Rate* | Monthly Repayment | Repayment type | Rate Type | Offset | Redraw | Ongoing Fees | Upfront Fees | Max LVR | Lump Sum Repayment | Extra Repayments | Split Loan Option | Tags | Features | Link | Compare | Promoted Product | Disclosure |
|---|---|---|---|---|---|---|---|---|---|---|---|---|---|---|---|---|---|---|---|---|
5.54% p.a. | 5.58% p.a. | $2,852 | Principal & Interest | Variable | $0 | $530 | 90% |
| Promoted | Disclosure | ||||||||||
5.49% p.a. | 5.40% p.a. | $2,836 | Principal & Interest | Variable | $0 | $0 | 80% |
| Promoted | Disclosure | ||||||||||
5.64% p.a. | 5.89% p.a. | $2,883 | Principal & Interest | Variable | $250 | $250 | 60% |
| Promoted | Disclosure | ||||||||||
5.64% p.a. | 5.89% p.a. | $2,883 | Principal & Interest | Variable | $248 | $350 | 60% |
| Disclosure |


")

Image by Belle Co via Pexels.

Ready, Set, Buy!
Learn everything you need to know about buying property – from choosing the right property and home loan, to the purchasing process, tips to save money and more!
With bonus Q&A sheet and Crossword!

 Harry O'Sullivan
 William Jolly