Driven by stronger rental demand and lower supply, rent values have continued to increase sharply across Australia.
But those living regionally or in smaller capital cities are copping the brunt of the rental affordability crisis according to the latest ANZ-CoreLogic Housing Affordability Report.
The portion of income required to pay rent in Hobart and Adelaide hit record highs in the March quarter, with renters needing to fork out 34.4% and 31.6% of their income respectively.
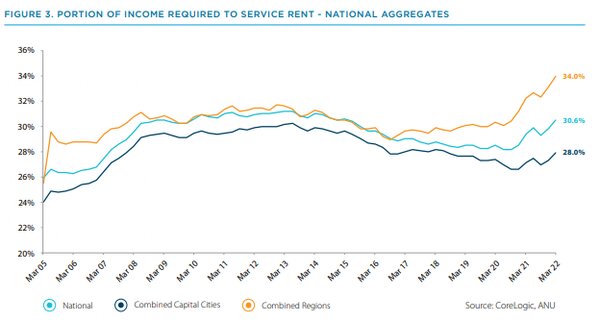
Regional renters saw affordability deteriorate more sharply when compared to combined capital city renters, as the household income required to meet rental payments hit a record high of 34% over the past quarter.
This is compared to average capital city renters who require 28% of their income.
The portion of household income required to meet rental payments now sits at 30.6% on a national level.
According to the report, rental serviceability has deteriorated most rapidly across the Richmond - Tweed market including Byron Bay.
Specifically, the portion of income required to pay median rents is now 53% in Byron Bay.
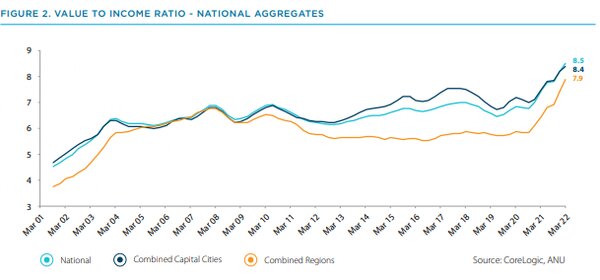
Housing values 8.5 times higher than household income
The national median dwelling value is now an estimated 8.5 times higher than the median annual household income - a new record high.
This can be compared to pre-pandemic levels when housing values were 6.8 times the average household income.
From March 2020 to March 2022, the value to household income ratio regionally also increased form 5.9 to 7.9 - faster than the increase in capital cities.
This is while median weekly income in capital cities are around 32.6% higher than regional Australians' incomes.
The capacity to pay and compete for regional housing on a capital city dwellers' income likely contributed to the rising housing costs in regional Australia according to the report.
Saving for a deposit now takes 11.4 years
Years needed to save up 20% for a deposit reached a record high of 11.4 years, assuming a household saves 15% of its income per annum.
Sydney home buyers would need to save the longest - years required to save a 20% deposit reached a record high of 14.1.
Based on the current median dwelling value in Australia - which is $738,975 - first home buyers would need to save $147,795 according to ANZ and CoreLogic.
The portion of household income required to service new mortgage repayments now sits at 41.4% nationally.
This is above the decade average of 36.5% but is below the record high experienced in March 2008.
Advertisement
Buying a home or looking to refinance? The table below features home loans with some of the lowest interest rates on the market for owner occupiers.
| Lender | Home Loan | Interest Rate | Comparison Rate* | Monthly Repayment | Repayment type | Rate Type | Offset | Redraw | Ongoing Fees | Upfront Fees | Max LVR | Lump Sum Repayment | Extra Repayments | Split Loan Option | Tags | Features | Link | Compare | Promoted Product | Disclosure |
|---|---|---|---|---|---|---|---|---|---|---|---|---|---|---|---|---|---|---|---|---|
5.54% p.a. | 5.58% p.a. | $2,852 | Principal & Interest | Variable | $0 | $530 | 90% |
| Promoted | Disclosure | ||||||||||
5.49% p.a. | 5.40% p.a. | $2,836 | Principal & Interest | Variable | $0 | $0 | 80% |
| Promoted | Disclosure | ||||||||||
5.64% p.a. | 5.89% p.a. | $2,883 | Principal & Interest | Variable | $250 | $250 | 60% |
| Promoted | Disclosure | ||||||||||
5.64% p.a. | 5.89% p.a. | $2,883 | Principal & Interest | Variable | $248 | $350 | 60% |
| Disclosure |


")

Image by Kylie O'Sullivan on Unsplash

Ready, Set, Buy!
Learn everything you need to know about buying property – from choosing the right property and home loan, to the purchasing process, tips to save money and more!
With bonus Q&A sheet and Crossword!


 Bea Garcia
 Denise Raward
 Harry O'Sullivan
 Rachel Horan