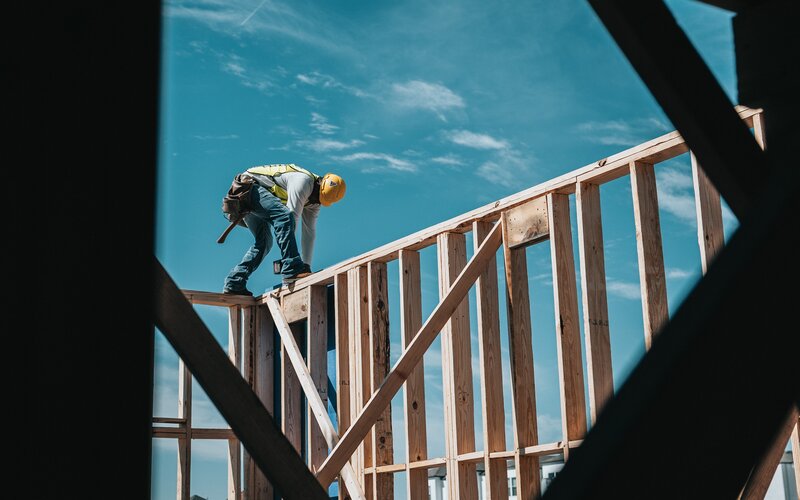
South Australia, Queensland, and the ACT are the best places in the nation build new houses, according to the latest housing Industry Association (HIA) housing scorecard report.
The report analysed each of the eight states and territories based on 13 residential and building indicators against ten-year averages. The indicators cover building activity and renovations, housing finance, and overseas and interstate migration.
South Australia topped the list with a score of 78 – meaning it scored an average of six out of a possible eight for all 13 indicators.
“This strong performance will be supported by policy changes announced in this year’s State Budget which included a reduction in stamp duty, the release of 25,000 blocks of land, and an investment in public housing stock,” HIA chief economist Tim Reardon said.
Coincidentally, Adelaide's median rental price is the lowest of all capital cities for both units and overall dwellings. For houses, Hobart took the crown.
Queensland wasn’t too far behind its southern counterpart for dwelling construction, raking in a score of 76. That came on the back of strong renovations and multi-unit building activity.
“Queensland is continuing to attract a large number of interstate and international migrants which are supporting home building,” Mr Reardon said.
“Despite this level of migration, building activity in Queensland remains constrained by a shortage of skilled labour.”
An influx of people moving to the ACT and Western Australia also helped bolster their respective scores, despite capacity restraints impacting the latter.
Meanwhile, Victoria and NSW slipped down the housing scorecard, recording respective scores of 49 and 54.
“New South Wales and Victoria have fallen down the list as the rise in the cash rate has adversely impacted these markets more significantly given their higher land costs,” Mr Reardon said.
“Supporting new home building in these markets by reducing costs, attracting more investment and improving capacity are essential to ensure that an adequate supply of new homes commence construction.”
Dwelling approvals - what does it all mean for supply?
It comes after the number of private sector houses approved to be built in Australia rose 0.9% last month, compared to a 20.6% jump in overall new dwelling approvals.
Meanwhile, the number of new loans signed for the construction of a house fell 40.4% over the 12 months to May, according to Australian Bureau of Statistics (ABS) data.
“Conditions for the residential building industry are undergoing a rebalancing as the market transitions from a record boom to the deepest trough in over a decade in 2024,” Mr Reardon said.
“As the industry progresses through this cycle, building activity in each region is starting to diverge.”
Advertisement
Building a home? This table below features construction loans with some of the lowest interest rates on the market.
| Lender | Home Loan | Interest Rate | Comparison Rate* | Monthly Repayment | Repayment type | Rate Type | Offset | Redraw | Ongoing Fees | Upfront Fees | Max LVR | Lump Sum Repayment | Extra Repayments | Split Loan Option | Tags | Features | Link | Compare | Promoted Product | Disclosure |
|---|---|---|---|---|---|---|---|---|---|---|---|---|---|---|---|---|---|---|---|---|
5.93% p.a. | 6.19% p.a. | $2,471 | Interest-only | Variable | $0 | $530 | 90% |
| Promoted | Disclosure | ||||||||||
5.69% p.a. | 5.71% p.a. | $2,899 | Principal & Interest | Variable | $0 | $350 | 80% | Disclosure | ||||||||||||
5.94% p.a. | 6.00% p.a. | $2,475 | Interest-only | Variable | $0 | $835 | 90% | |||||||||||||
6.24% p.a. | 6.31% p.a. | $2,600 | Interest-only | Variable | $0 | $450 | 80% | |||||||||||||
6.44% p.a. | 6.41% p.a. | $2,683 | Interest-only | Variable | $0 | $530 | 90% | |||||||||||||
6.74% p.a. | 7.51% p.a. | $2,808 | Interest-only | Variable | $20 | $644 | 90% | |||||||||||||
7.89% p.a. | 8.22% p.a. | $3,631 | Principal & Interest | Variable | $0 | $0 | 75% | |||||||||||||
7.19% p.a. | 6.90% p.a. | $2,996 | Interest-only | Variable | $0 | $1,212 | 90% | |||||||||||||
8.18% p.a. | 8.25% p.a. | $3,732 | Principal & Interest | Variable | $0 | $900 | 80% | |||||||||||||
5.94% p.a. | 6.36% p.a. | $2,978 | Principal & Interest | Variable | $395 | $null | 95% | |||||||||||||
5.18% p.a. | 5.63% p.a. | $2,739 | Principal & Interest | Variable | $350 | $0 | 90% |
Image by Josh Olalde on Unsplash

Ready, Set, Buy!
Learn everything you need to know about buying property – from choosing the right property and home loan, to the purchasing process, tips to save money and more!
With bonus Q&A sheet and Crossword!


