According to CoreLogic’s Cordell Construction Cost Index (CCCI), the quarterly growth rate of 2.4% is more than double the rate seen in the last quarter of 2021 (1.1%).
The Cordell costings team found the cost of metal, structural steel, reinforcing, fixings, and fencings are all under pressure. Additionally, prices for timber products continue to soar faster than normal with volatility remaining.
Appliances and other fit-out items are also experiencing higher than normal increases, particularly those that are imported.
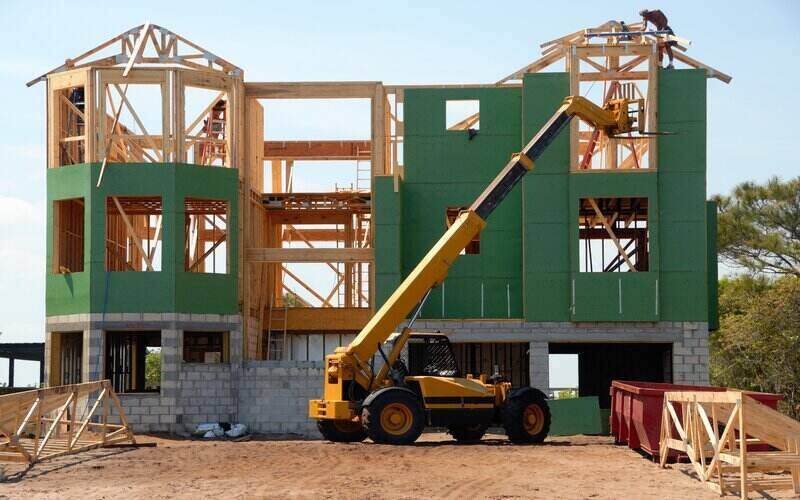
CoreLogic construction cost estimation manager John Bennett said the increase in construction materials along with other pressures have had a big impact on the industry as a whole.
“Suppliers are frequently mentioning the impact of rising fuel, freight and electricity costs on their bottom line and these are significant additional challenges being faced by the industry,” Mr Bennett said.
“It is important to note these factors only add to other pressures that have impacted the residential construction industry for 18 months now, such as labour availability and overheads.
“A shortage of labour and materials means a delay in completion times, which leaves builders vulnerable to market changes and holding costs.”
Tim Lawless, CoreLogic research director, explained the impact economic conditions have had on construction costs.
“Construction cost growth is an additional concern to an industry already under immense workload pressures as well as economic conditions such as rising interest rates and inflationary pressures,” Mr Lawless said.
“Construction costs have increased more than 25% over the past five years, which has a knock on effect to builders’ margins, budget blowouts for customers not on fixed price contracts and home owners waiting for their projects to finish or even start in many cases.
“It’s also impacting the insurance industry, as home owners struggle to reassess existing policies to make sure they are adequately covered in the event they need to make a claim.”
According to Mr Lawless, the short to medium-term forecast for the construction industry remains a challenge with a continuing demand-side pressure for materials and labour.
Already a number of construction companies have collapsed, unable to keep up with soaring costs and a backlog of work with quotes made months or years ago.
State by state construction cost key findings
New South Wales
NSW saw a rise in construction costs by 2.5% over the three months to June 2022 which was its second largest quarterly increase in more than a decade.
Annually, costs have risen 10.1% over the last 12 months to June 2022 compared to 3.4% the previous year.
Victoria
Victoria recorded a 2.5% increase in construction costs over the June quarter which was slightly up from 2.4% over the March quarter.
The annual increase was 10.0% across the state, overtaking the 12 months to March 2022 (8.8%) as the facets pace of growth in construction costs since June 2021.
Queensland
The sunshine state saw construction costs rise by 2.3% over the June 2022 quarter which is slightly less than the national quarterly growth rate of 2.4%.
Annually, costs have increased by 9.6% and while this is the highest annual increase the state has recorded since the 12 months to March 2011, it is the lowest annual increase of all five states.
Western Australia
Western Australia recorded the second highest annual increase in construction costs with 10.4% in the 12 months to June 2022.
The quarterly increase was slightly lower than the national growth rate.
South Australia
South Australia recorded the highest annual increase in construction costs of all states, up 10.5%.
The state’s quarterly growth rate was 2.2% which is the lowest increase of all five states.
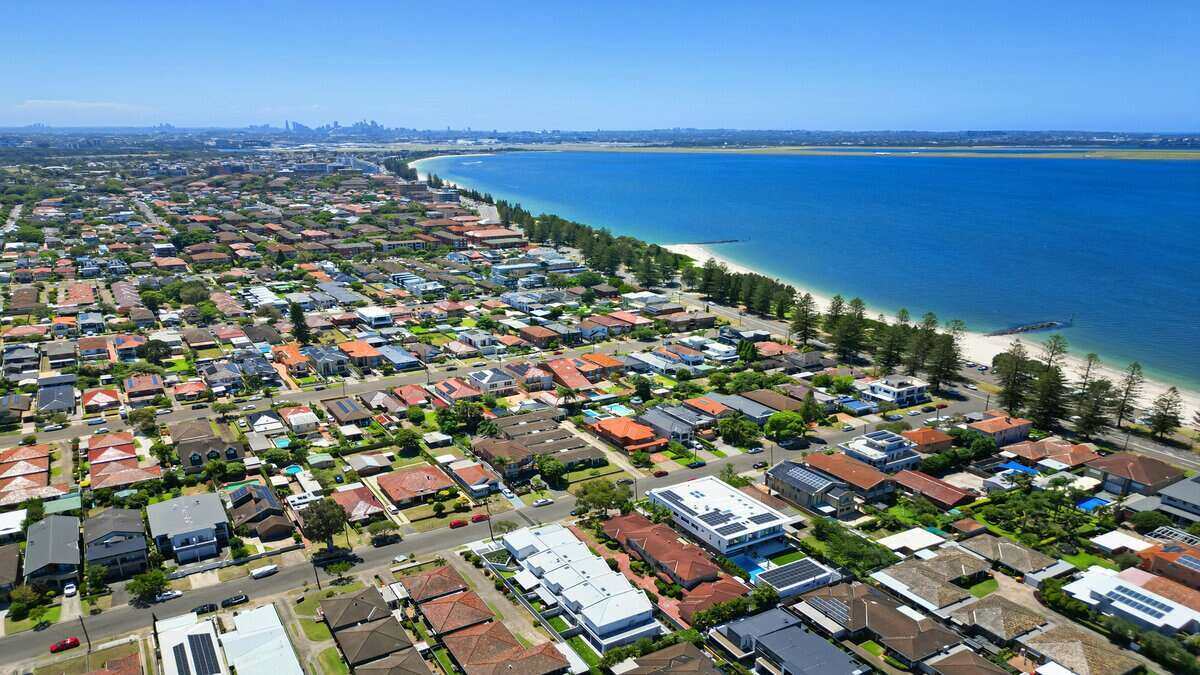
Dwelling approvals rise in May: ABS
ABS data shows the pipeline of work could continue to mount, with the total number of dwellings approved rising 9.9% through May in seasonally adjusted terms.
“The increase in the total number of dwellings approved in May was driven by approvals for private sector dwellings excluding houses, which rose 32.0%,” said Daniel Rossi, ABS director of Construction Statistics.
“Approvals for private sector houses fell 2.7% in May, following a 0.2% fall in April.”
Across the country, Western Australia saw the highest approval for dwellings at 38.7% in seasonally adjusted terms.
Tasmania followed suit with 26.8% while Queensland and New South Wales also recorded increases of 20.9% and 4.7% respectively.
In South Australia and Victoria, both states’ dwelling approvals decreased by -21.3% and -6.6%.
In terms of approvals for private sector houses, all states apart from Western Australia (4.9% rise) recorded a decrease in seasonally adjusted terms.
New South Wales led the pack with -11.1%; South Australia, -4.1%; Queensland, -1.3%; and Victoria, -0.9%.
Advertisement
Building a home? This table below features construction loans with some of the lowest interest rates on the market.
| Lender | Home Loan | Interest Rate | Comparison Rate* | Monthly Repayment | Repayment type | Rate Type | Offset | Redraw | Ongoing Fees | Upfront Fees | Max LVR | Lump Sum Repayment | Extra Repayments | Split Loan Option | Tags | Features | Link | Compare | Promoted Product | Disclosure |
|---|---|---|---|---|---|---|---|---|---|---|---|---|---|---|---|---|---|---|---|---|
5.93% p.a. | 6.19% p.a. | $2,471 | Interest-only | Variable | $0 | $530 | 90% |
| Promoted | Disclosure | ||||||||||
5.69% p.a. | 5.71% p.a. | $2,899 | Principal & Interest | Variable | $0 | $350 | 80% | Disclosure | ||||||||||||
5.94% p.a. | 6.00% p.a. | $2,475 | Interest-only | Variable | $0 | $835 | 90% | |||||||||||||
6.14% p.a. | 6.53% p.a. | $2,558 | Interest-only | Variable | $null | $721 | 90% | |||||||||||||
6.24% p.a. | 6.31% p.a. | $2,600 | Interest-only | Variable | $0 | $450 | 80% | |||||||||||||
6.44% p.a. | 6.41% p.a. | $2,683 | Interest-only | Variable | $0 | $530 | 90% | |||||||||||||
6.74% p.a. | 7.51% p.a. | $2,808 | Interest-only | Variable | $20 | $644 | 90% | |||||||||||||
8.14% p.a. | 8.47% p.a. | $3,718 | Principal & Interest | Variable | $0 | $0 | 75% | |||||||||||||
8.45% p.a. | 7.53% p.a. | $3,521 | Interest-only | Variable | $0 | $1,212 | 90% | |||||||||||||
8.18% p.a. | 8.25% p.a. | $3,732 | Principal & Interest | Variable | $0 | $900 | 80% | |||||||||||||
5.94% p.a. | 6.36% p.a. | $2,978 | Principal & Interest | Variable | $395 | $null | 95% | |||||||||||||
5.18% p.a. | 5.77% p.a. | $2,739 | Principal & Interest | Variable | $350 | $0 | 90% |


Image by Pixabay via Pexels

Ready, Set, Buy!
Learn everything you need to know about buying property – from choosing the right property and home loan, to the purchasing process, tips to save money and more!
With bonus Q&A sheet and Crossword!

 Harry O'Sullivan
 Harrison Astbury
 Denise Raward
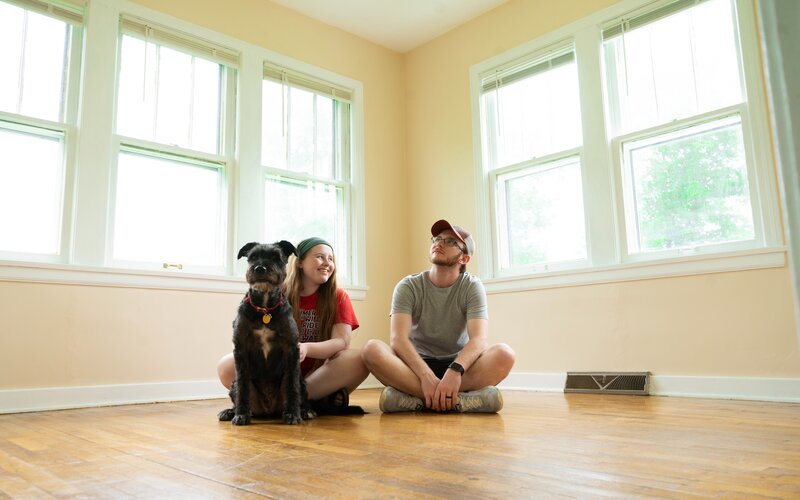
 Rachel Horan